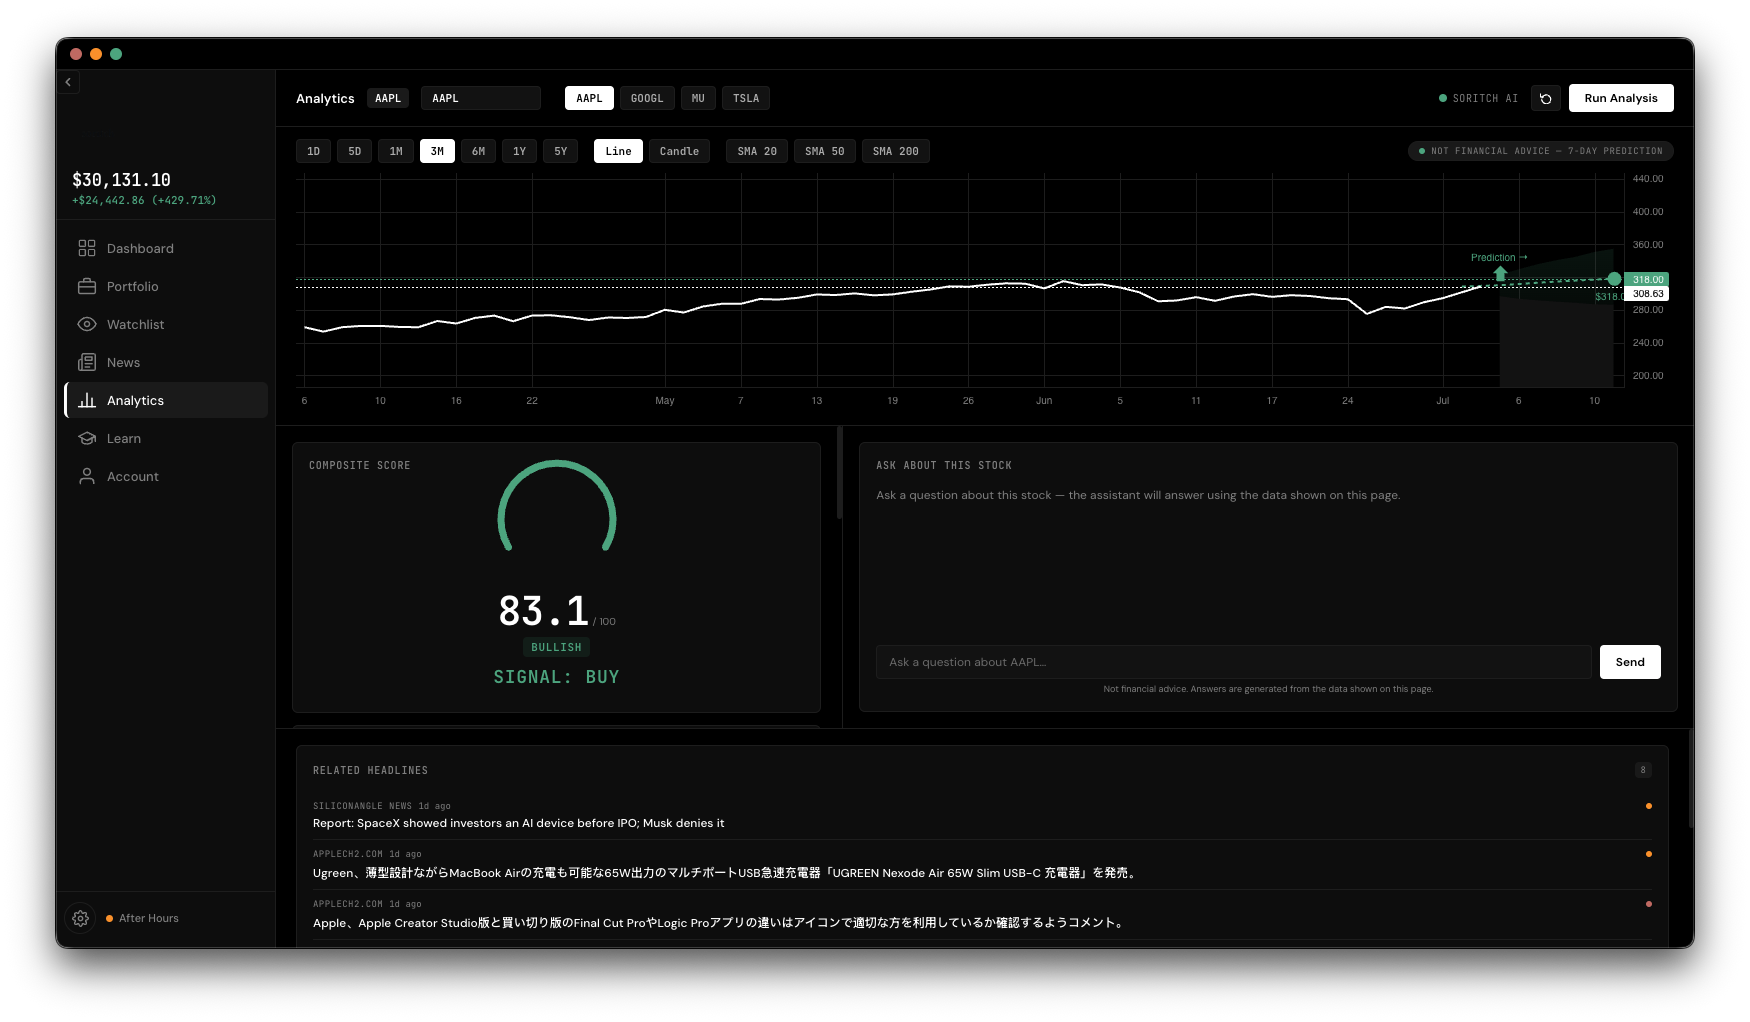
Analytics
Analytics takes any stock and turns it into a single 0–100 score, a BUY/HOLD/SELL signal, and an AI write-up in everyday language — no finance background required. It's decision support, not a trading system, and every result is clearly labeled as not financial advice.
Type a ticker into the search box at the top (autocomplete will help you find it), or click Analyze from a holding or watchlist card to arrive pre-loaded. Click Run Analysis and watch a status bar walk through progress while it pulls data and puts the score together — this usually takes a few seconds.
The headline number is a 0–100 gauge with a plain-language label — Bearish, Weak, Neutral, Favorable, or Bullish — plus a BUY / HOLD / SELL signal chip. Below it, a breakdown shows how the individual pieces stack up:
A separate macro adjustment nudges the score up or down based on what's happening across the stock's broader sector.
Beneath the score, an AI Outlook card gives you an Outlook, Risk, and Watch summary written in plain, jargon-free language, plus a Key Metrics grid for anyone who wants the underlying numbers. A Flags card calls out special conditions worth knowing about, like a stock currently in a volatility squeeze, one where insiders are selling despite strong earnings, or one that just moved sharply enough that a directional call can't be made reliably yet.
The price chart includes a shaded band projecting a range of likely outcomes over the next 7 days — a median line with an upper and lower bound, not a single prediction. It's meant to frame a plausible range, not to call a number. Like everything else on this page, it's clearly marked as not financial advice.
Once an analysis has run, an AI chat panel appears on the right. It's grounded specifically in that ticker's just-completed analysis — the score, the write-up, the flags, recent headlines — so you can ask follow-up questions and get answers tied to what's actually on the page.
Analytics needs an AI provider to generate the sentiment score and write-up, chosen in Settings:
A small status dot near the chat panel shows whether your chosen provider is currently reachable — green, amber, or red — with a tooltip explaining what's wrong if it isn't. If the AI portion can't run, the rest of the score (Trend, Momentum, Fundamentals, Volatility, and the forecast) still computes normally; only the news-sentiment and macro portions fall back to a simpler estimate.
A result is cached per ticker, per day, per provider — coming back to the same ticker later that day loads instantly instead of re-running. Click the ↻ button anytime to force a fresh run.