Portfolio
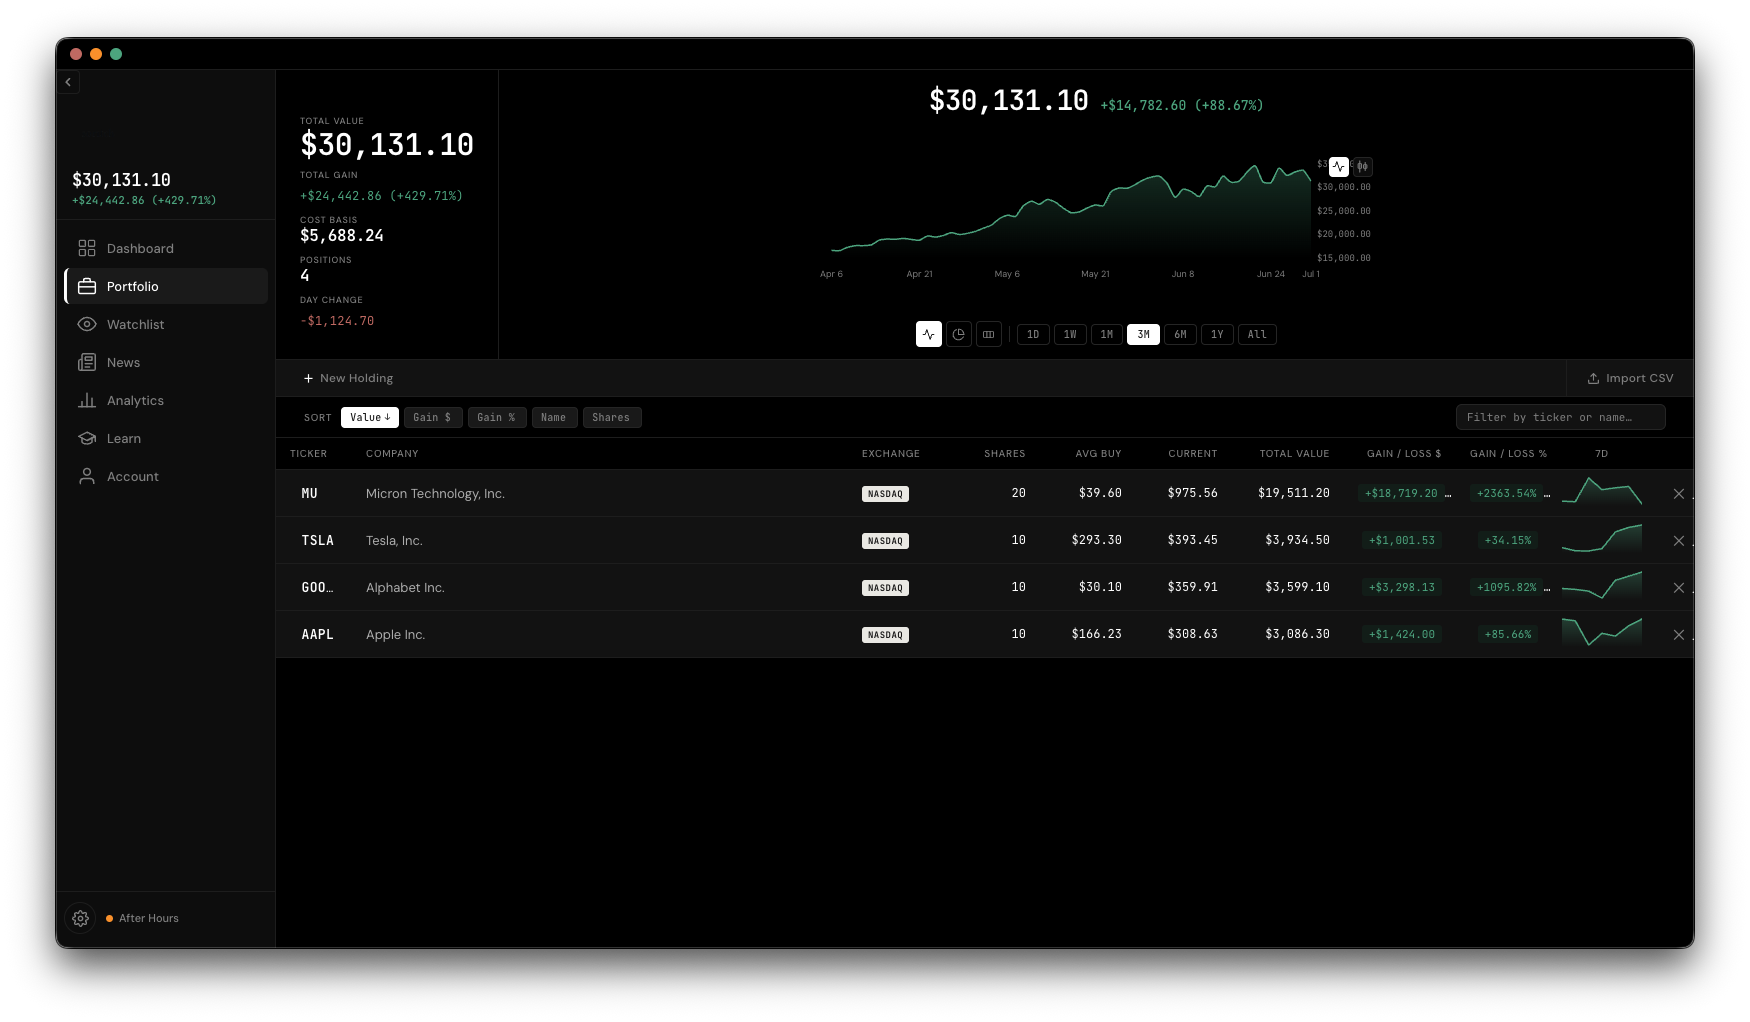
Portfolio is where you track what you actually own — add positions by hand or import them from a broker CSV, then sort, filter, and drill into any holding from a single table.
Click + New Holding to expand the add form, then fill in:
If the ticker can't be found, you'll get an inline error asking you to double-check the symbol instead of a silent failure.
Already tracking positions elsewhere? Click Import CSV and pick a file. Broker-style exports — the kind you'd get from Interactive Brokers and similar platforms — are recognized automatically, and multiple rows for the same ticker are combined into one position with a weighted average buy price. You'll see a live "importing N/M" progress indicator while it works.
Above the table, five chips let you sort by Value, Gain $, Gain %, Name, or Shares — click one to sort by it, click the same one again to flip the direction. The search box next to it filters live as you type, matching against ticker or company name.
Holdings are grouped by ticker. If you've bought the same stock more than once, you'll see one summary row with a weighted average buy price — click the › chevron to expand it into each individual purchase, with its own date, share count, and gain. Each row (or lot) has its own remove button, which asks for confirmation before deleting anything.
Click anywhere on a holding's row (not the chevron or remove button) to slide in a detail panel: a live price tracker, your gain in dollars and percent, a price chart from your purchase date to today with adjustable ranges, and key stats like 52-week high/low, volume, and market cap.
Every time you open the app, your holdings refresh automatically — prices, sparklines, and stats update one by one as each finishes. You can also trigger a manual refresh anytime from Account → Sync Now.
Your display currency (set in Settings or Account) changes how values are shown app-wide, instantly and with no extra loading — it's purely a display conversion. What you actually own is still tracked in the currency you originally paid in.