The portfolio tracker that tells you why

Built for people who manage their own money. Runs on your desktop, and your holdings never leave it.

New Trading journal
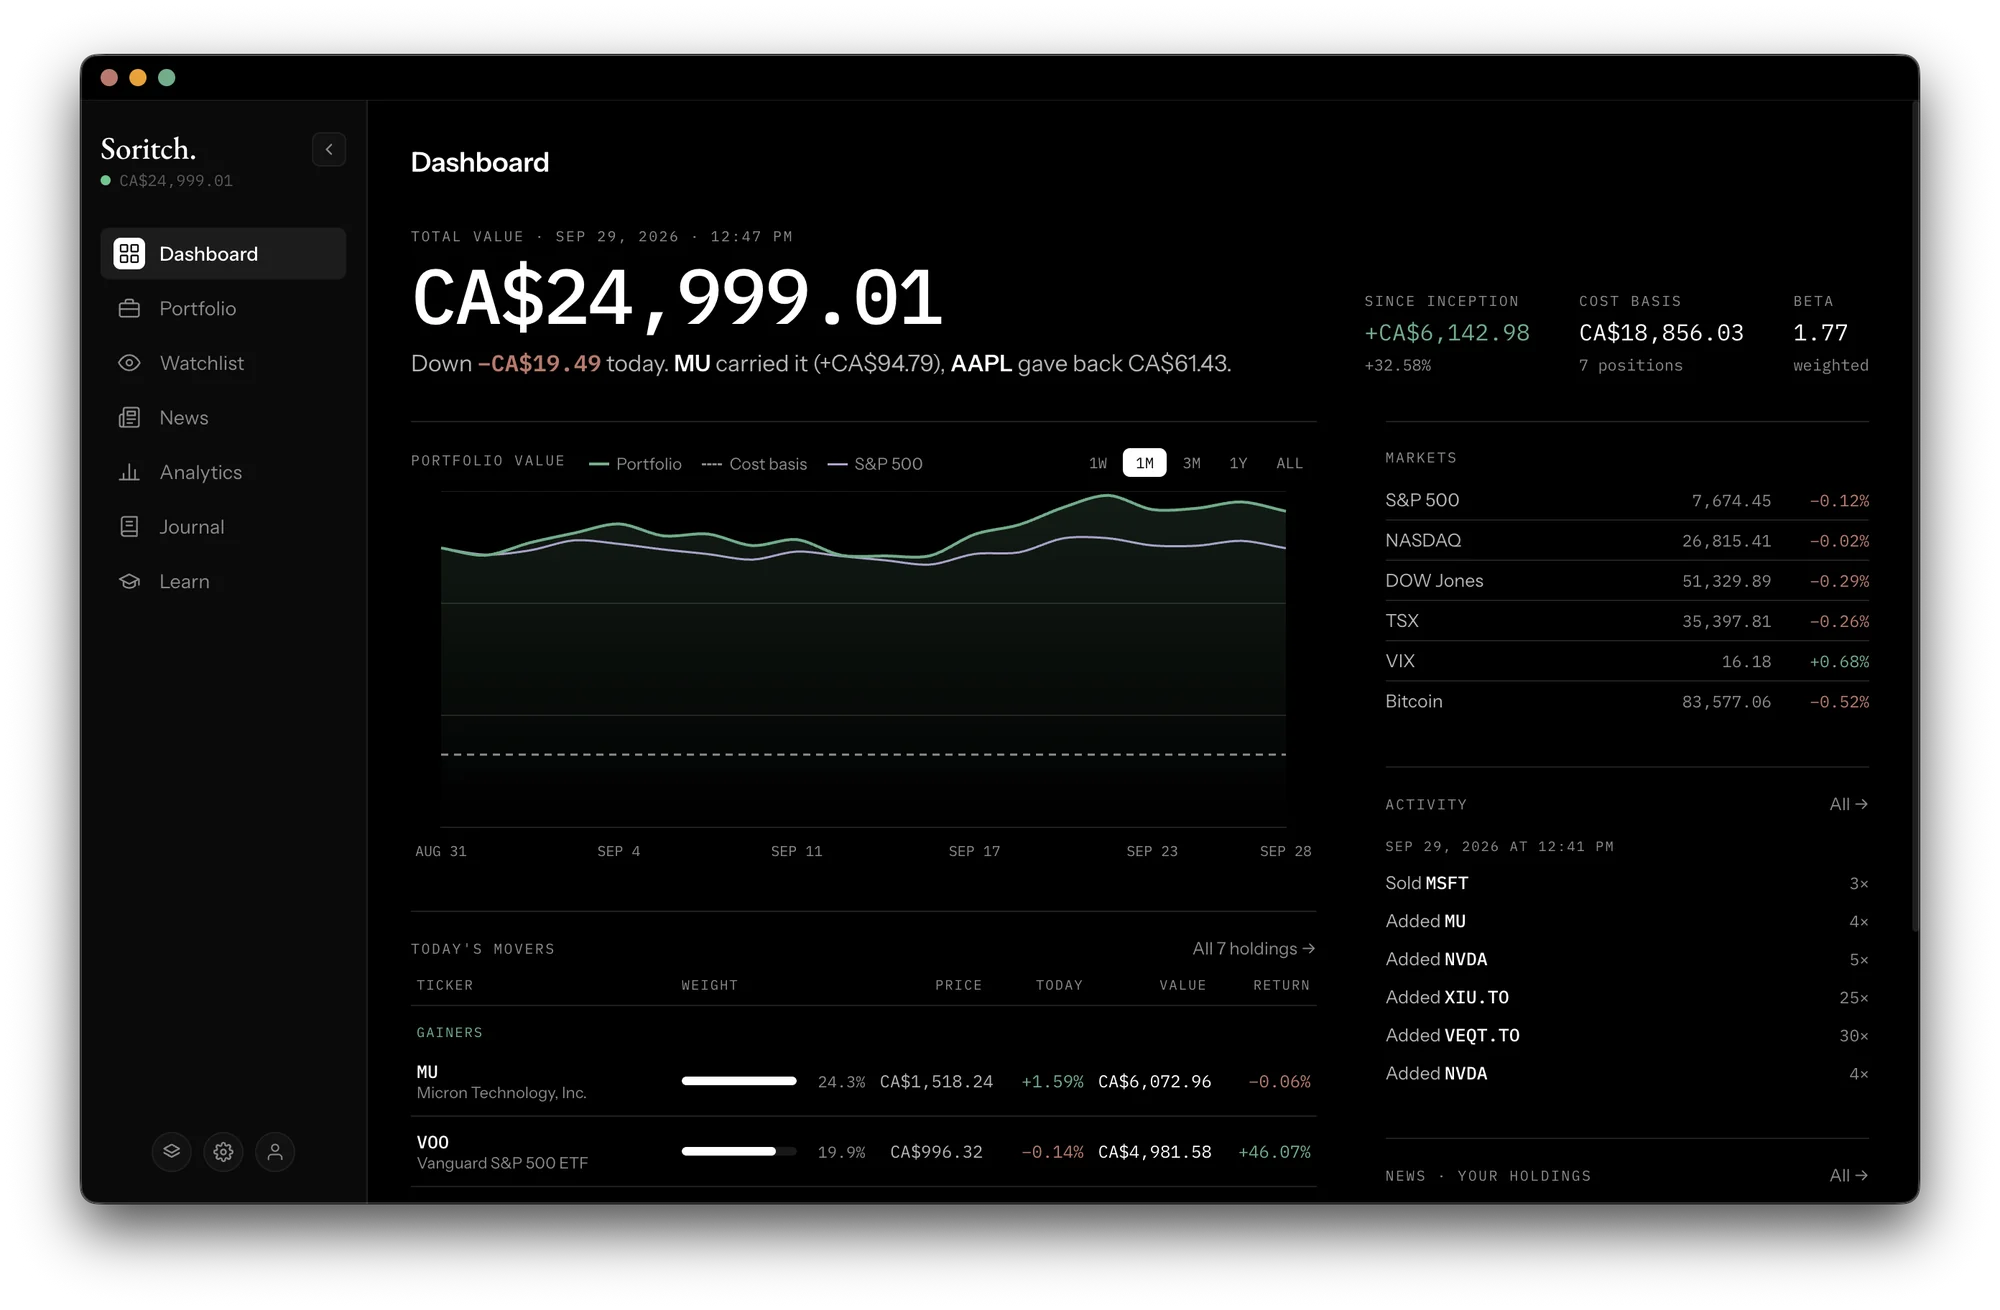
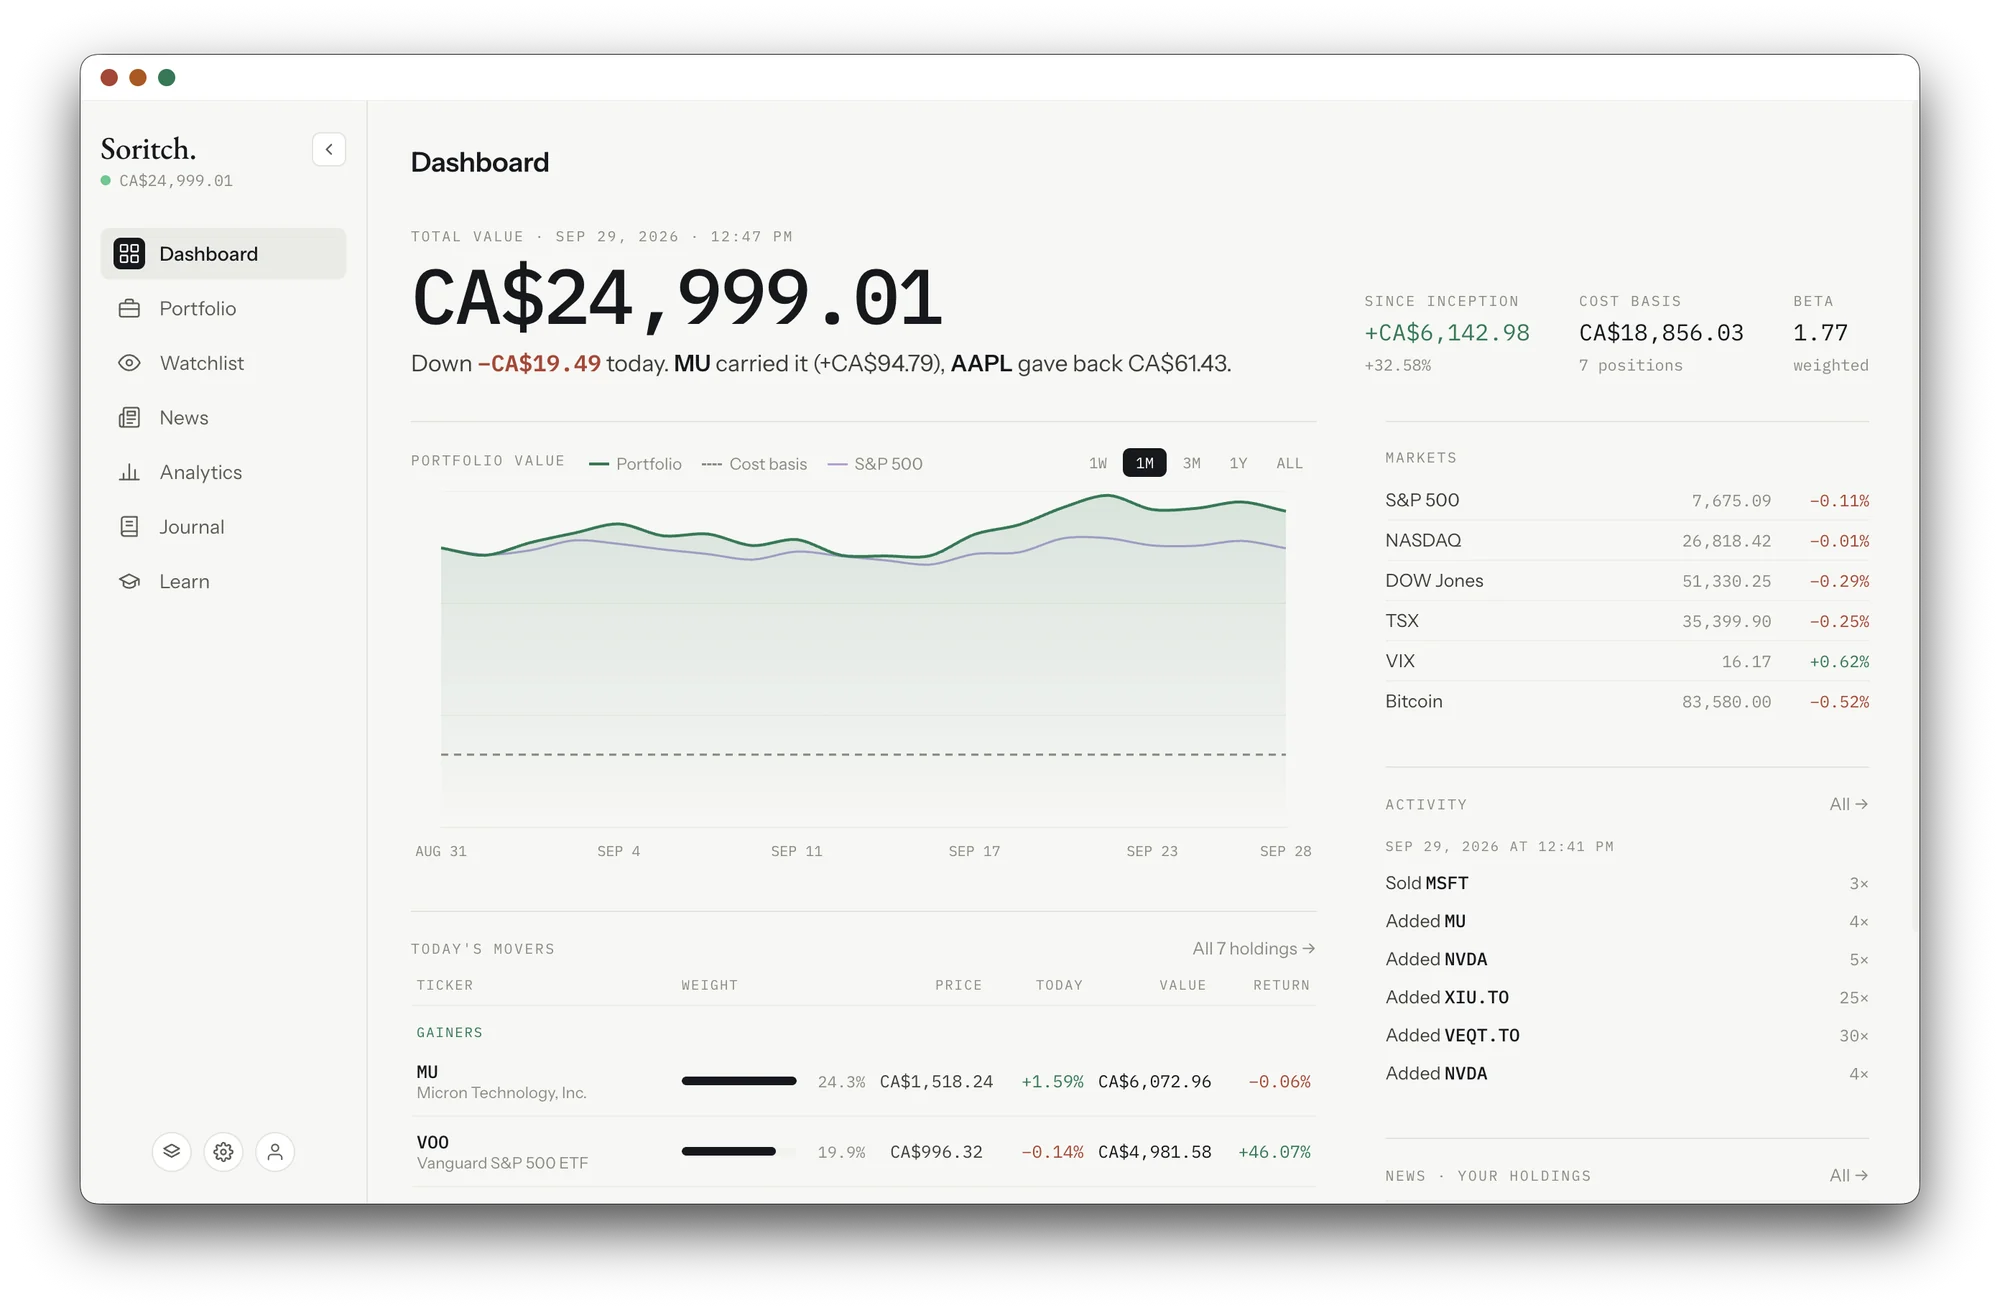
Soritch dashboard: total value of CA$24,999.01, a sentence explaining the day's move, portfolio chart against the market of your choice's,  indices and recent activity Soritch dashboard in light mode

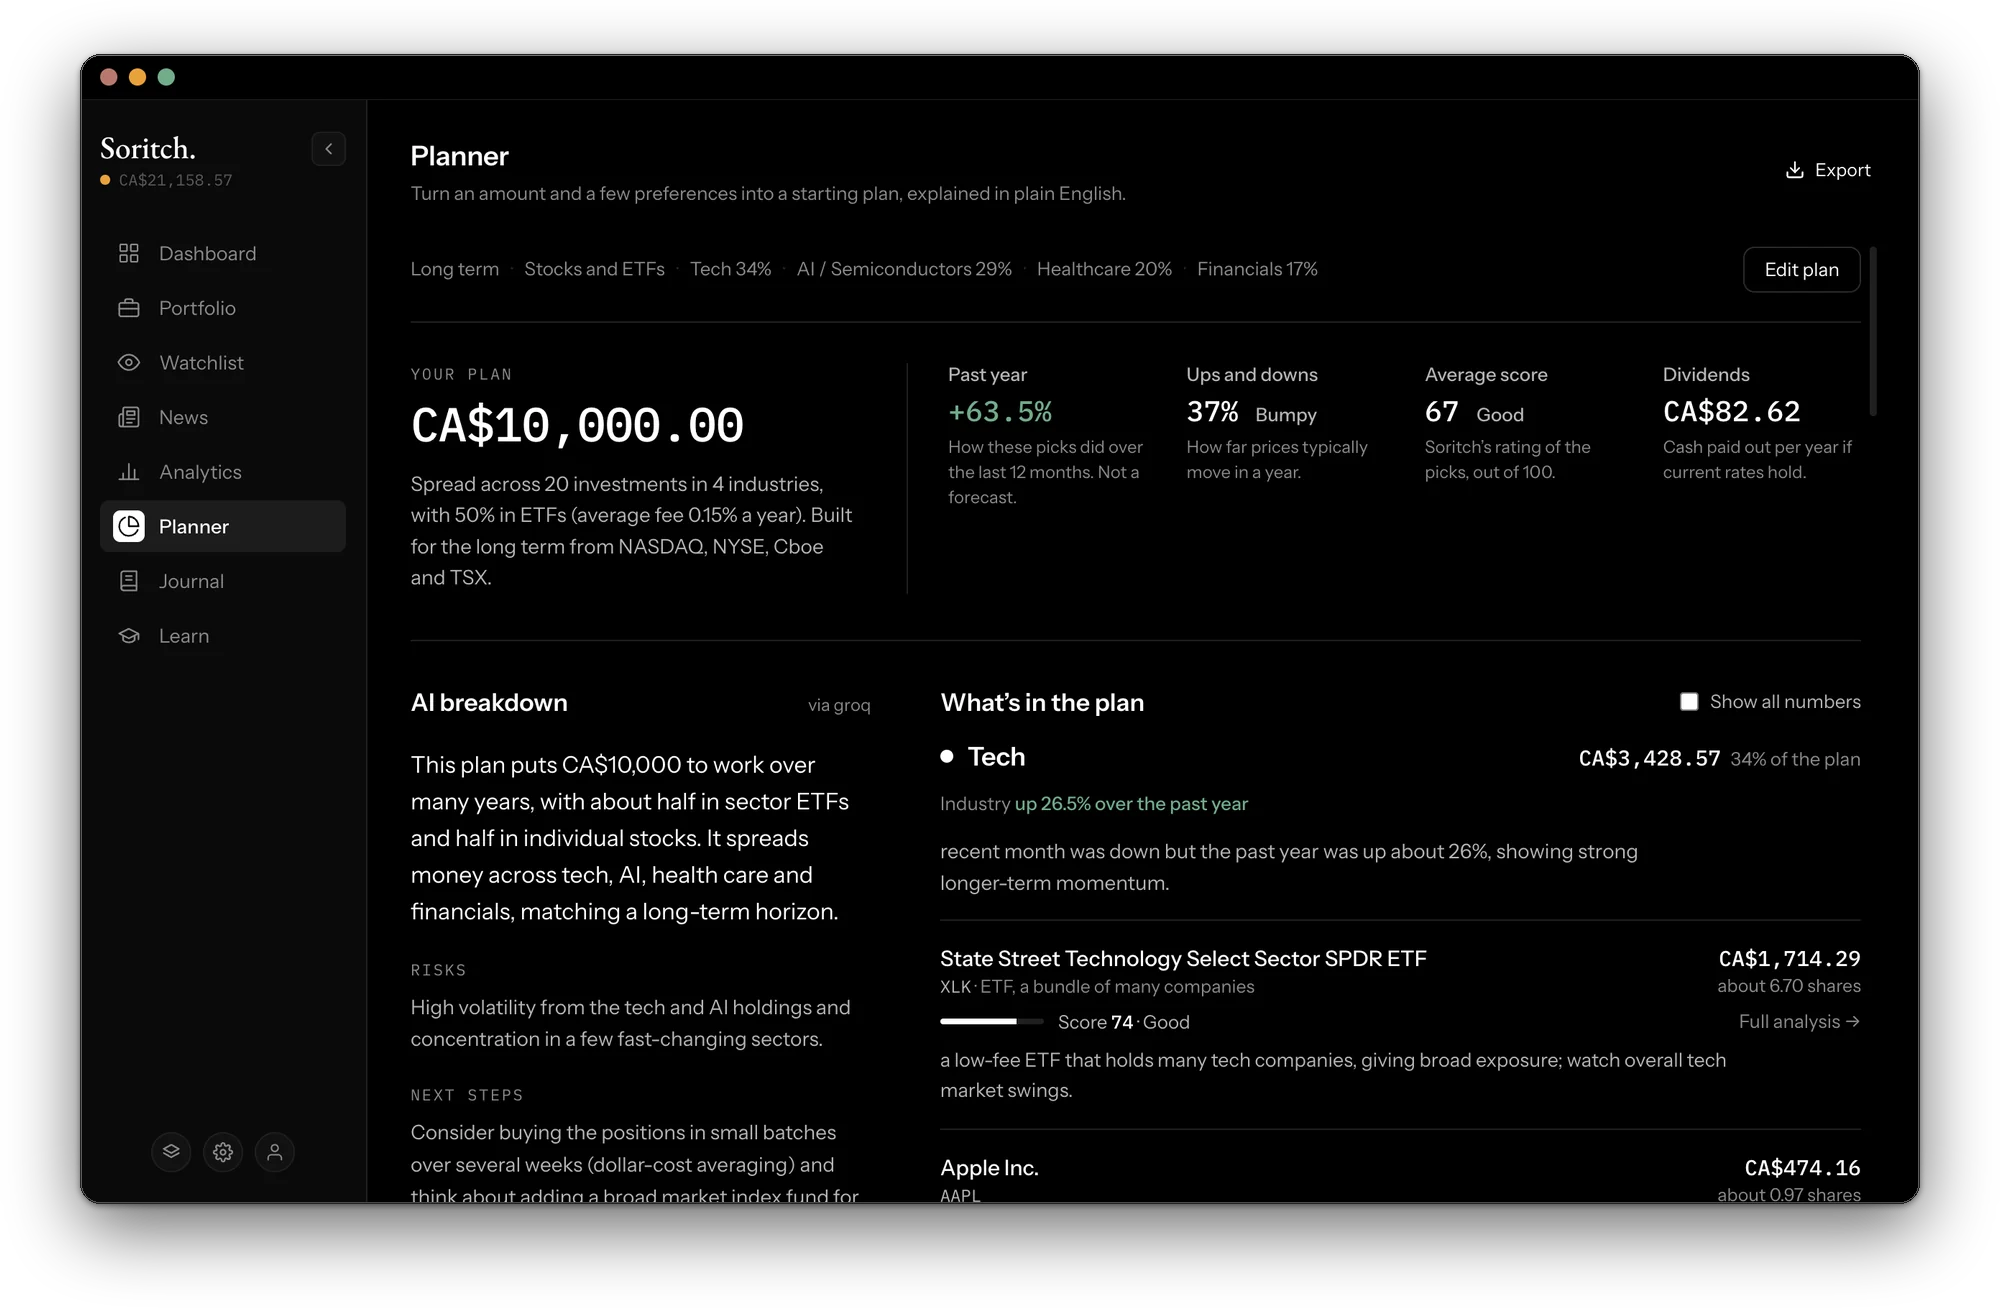
A different kind of portfolio tracker. Most apps show you how much you made or lost. Soritch explains what caused it, scores what you own, and keeps a record of why you bought each position.

Fig 0.1

Private by default

Holdings, journal entries and lessons are saved as files on your computer, behind a passcode.

Fig 0.2

Explains every move

A plain-English summary of each day, and a chart of which positions actually earned your return.

Fig 0.3

Scores what you own

A 0–100 score for any stock or ETF, broken into the parts that produced it.

Tracking
and performance

See every account in one place. The dashboard opens with a sentence about what moved today.

Get early access
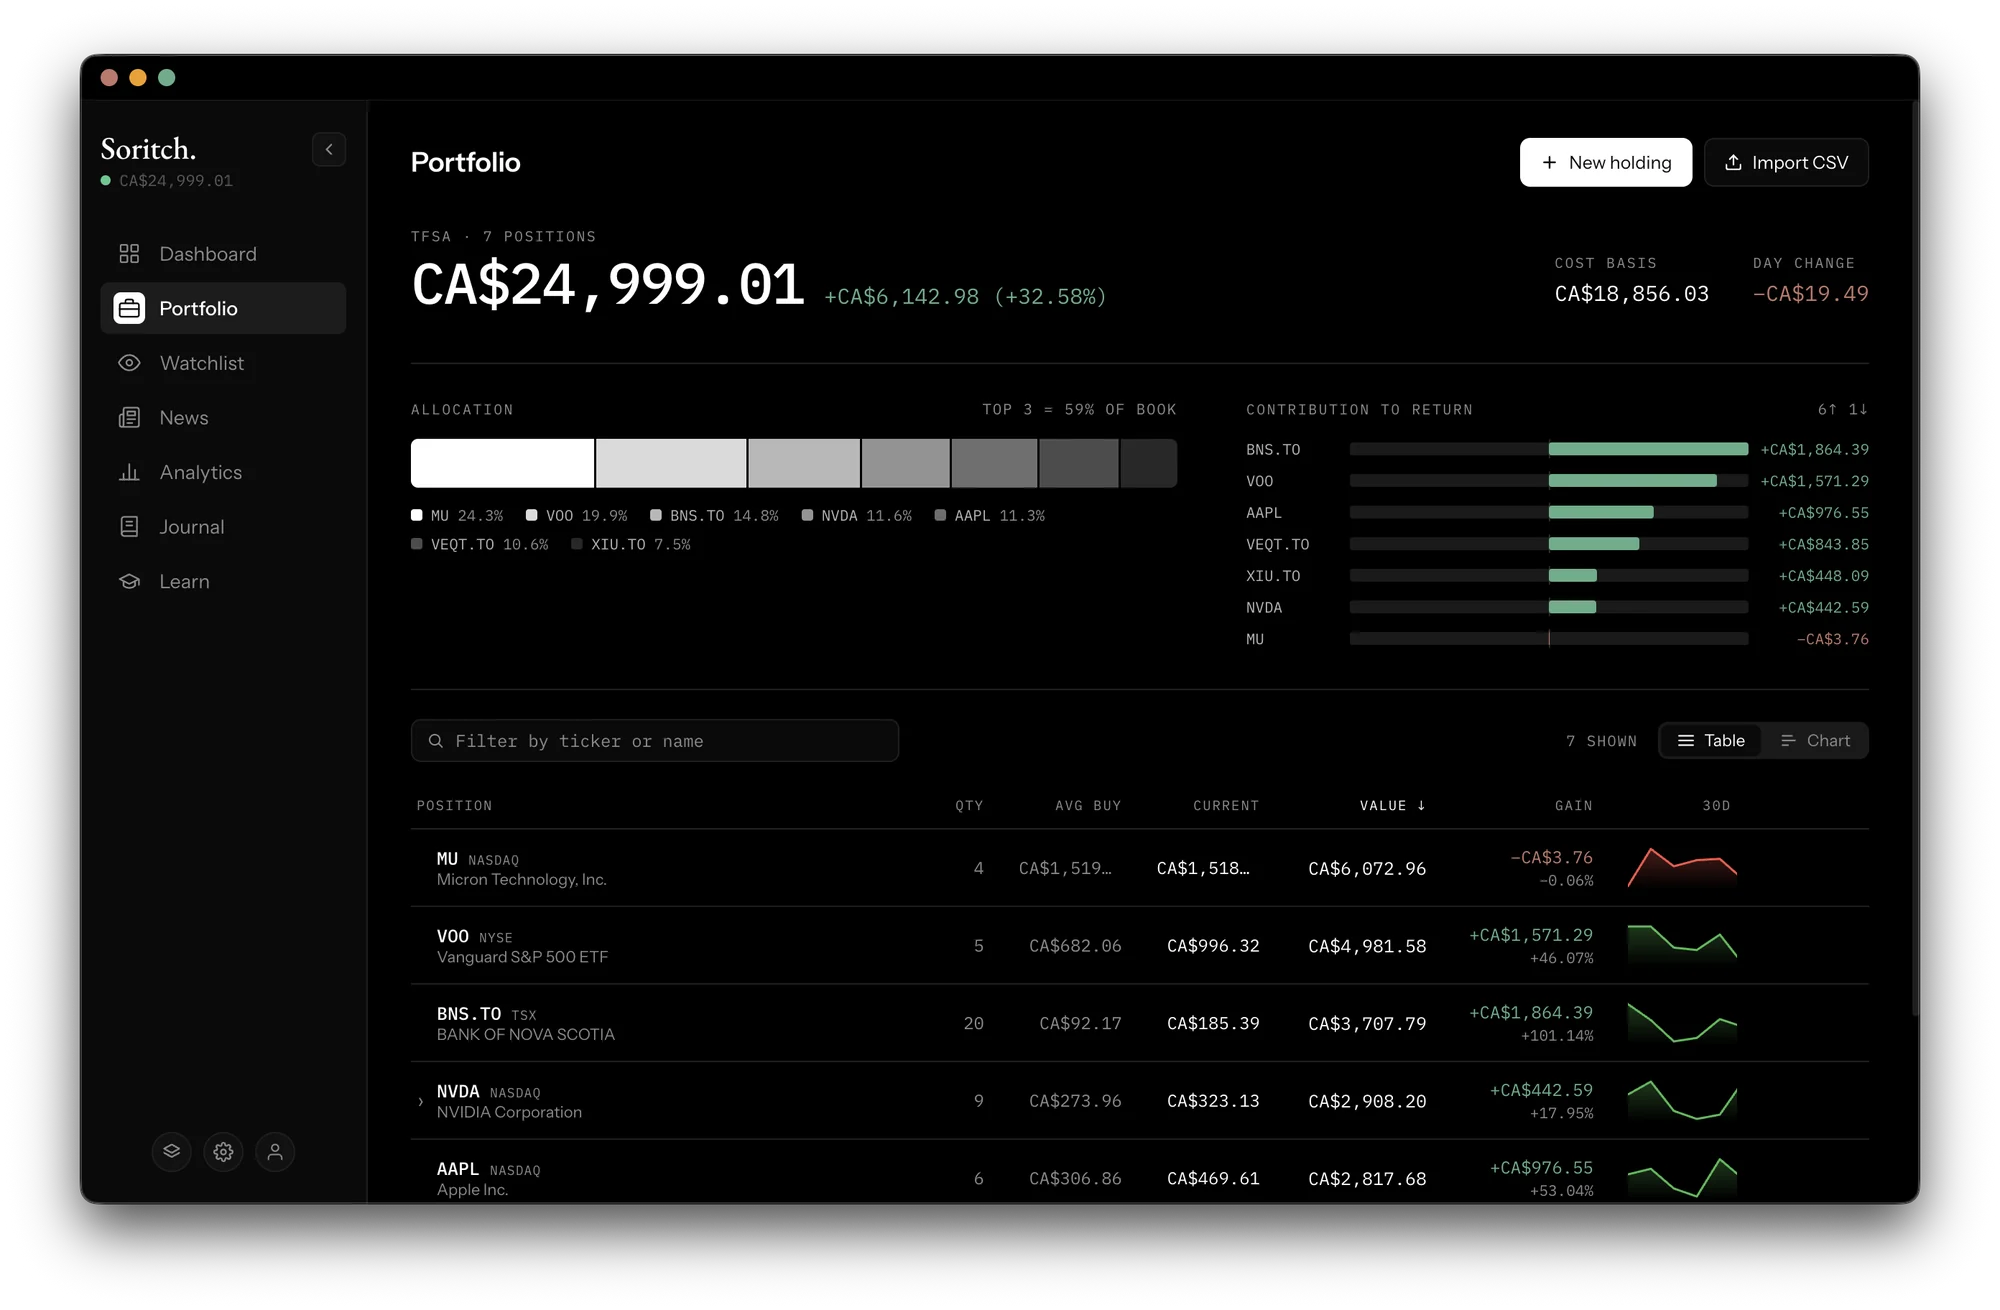
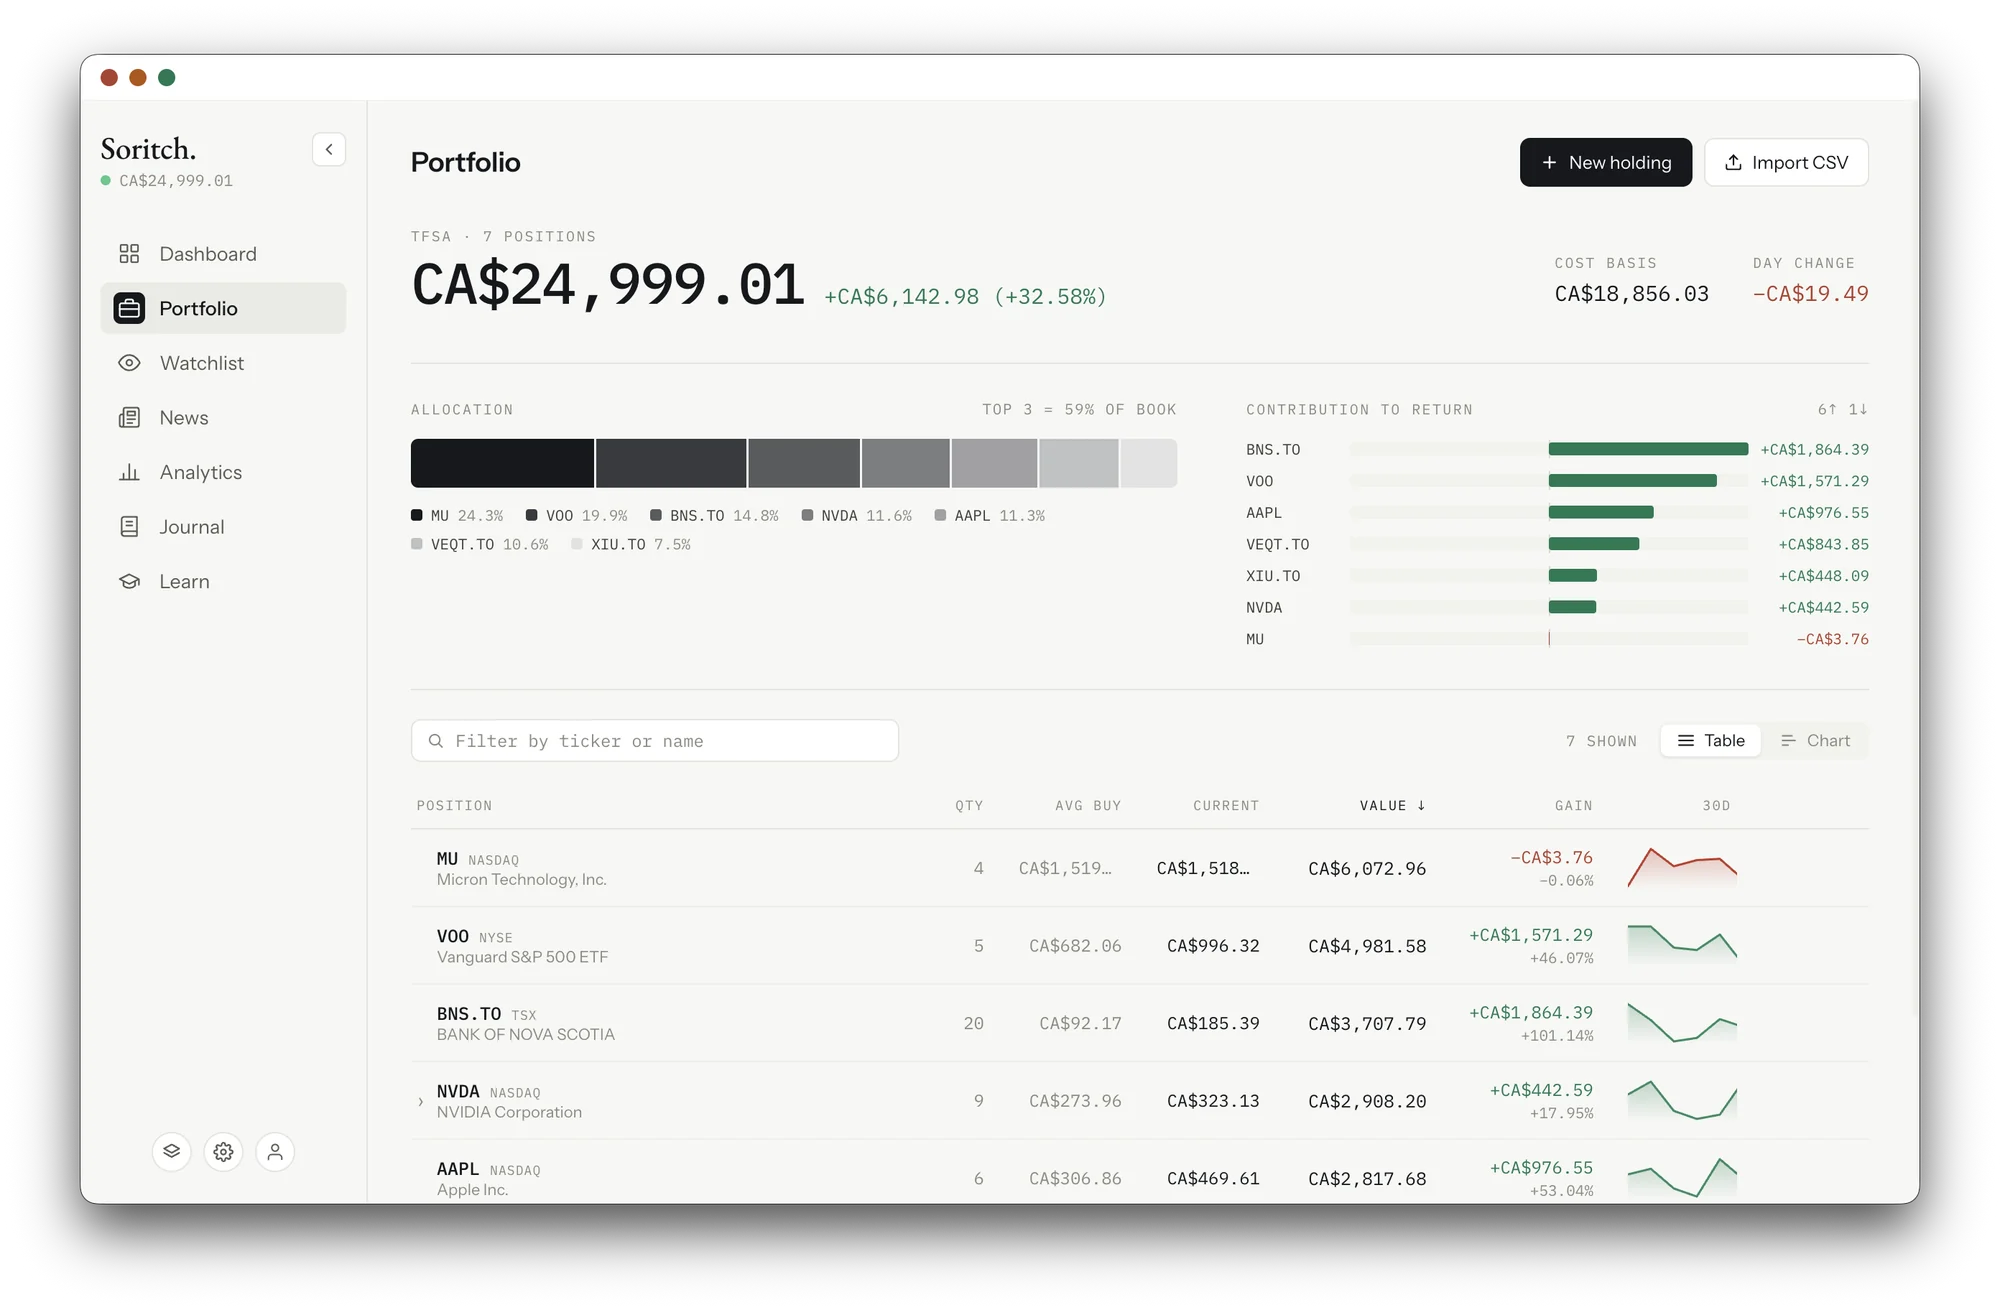
Portfolio screen with allocation bar, contribution to return and holdings table Portfolio screen in light mode
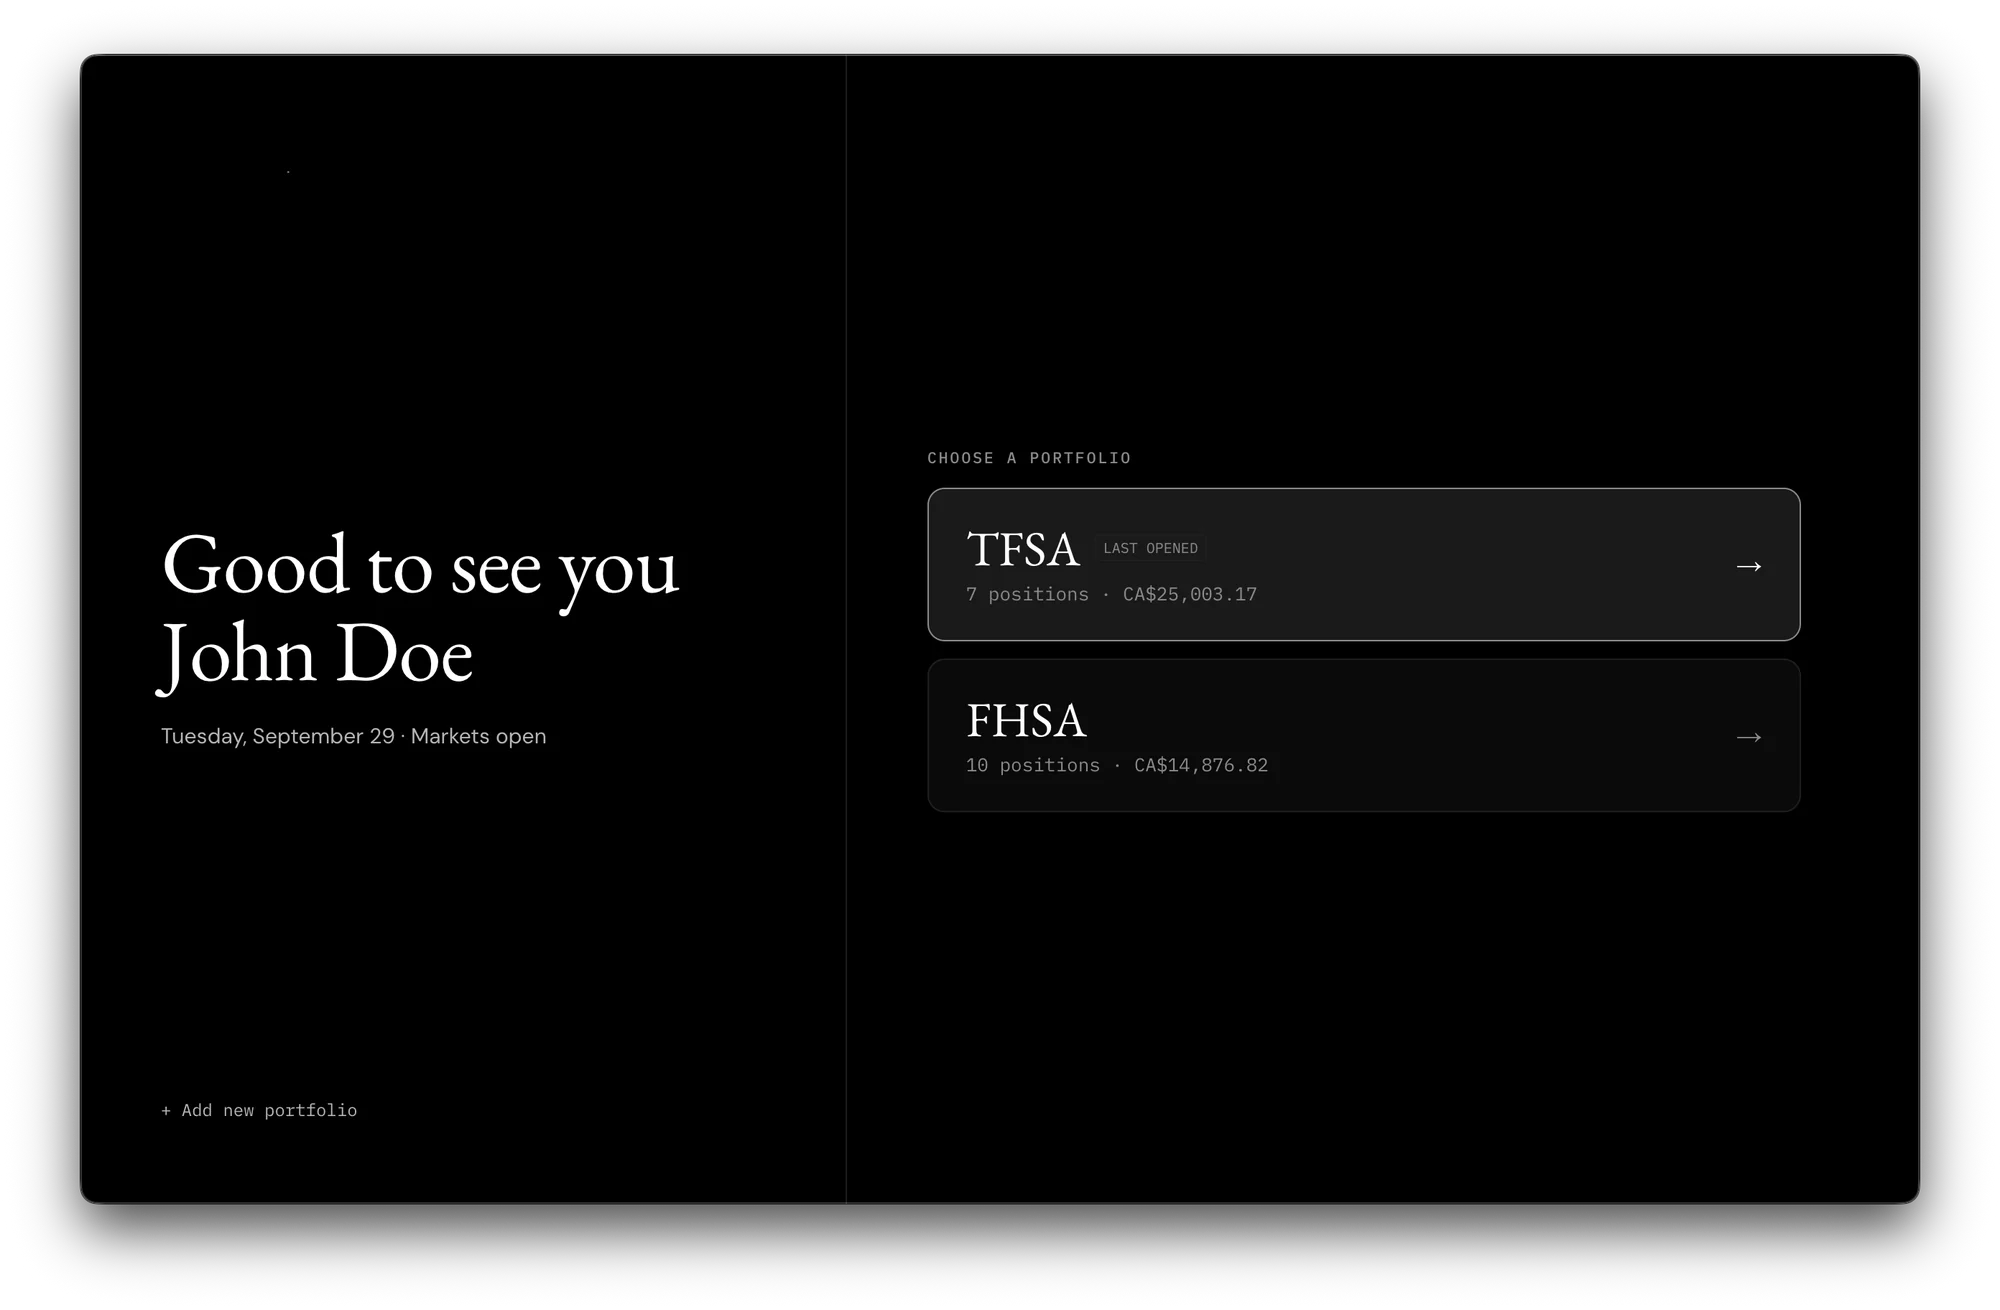
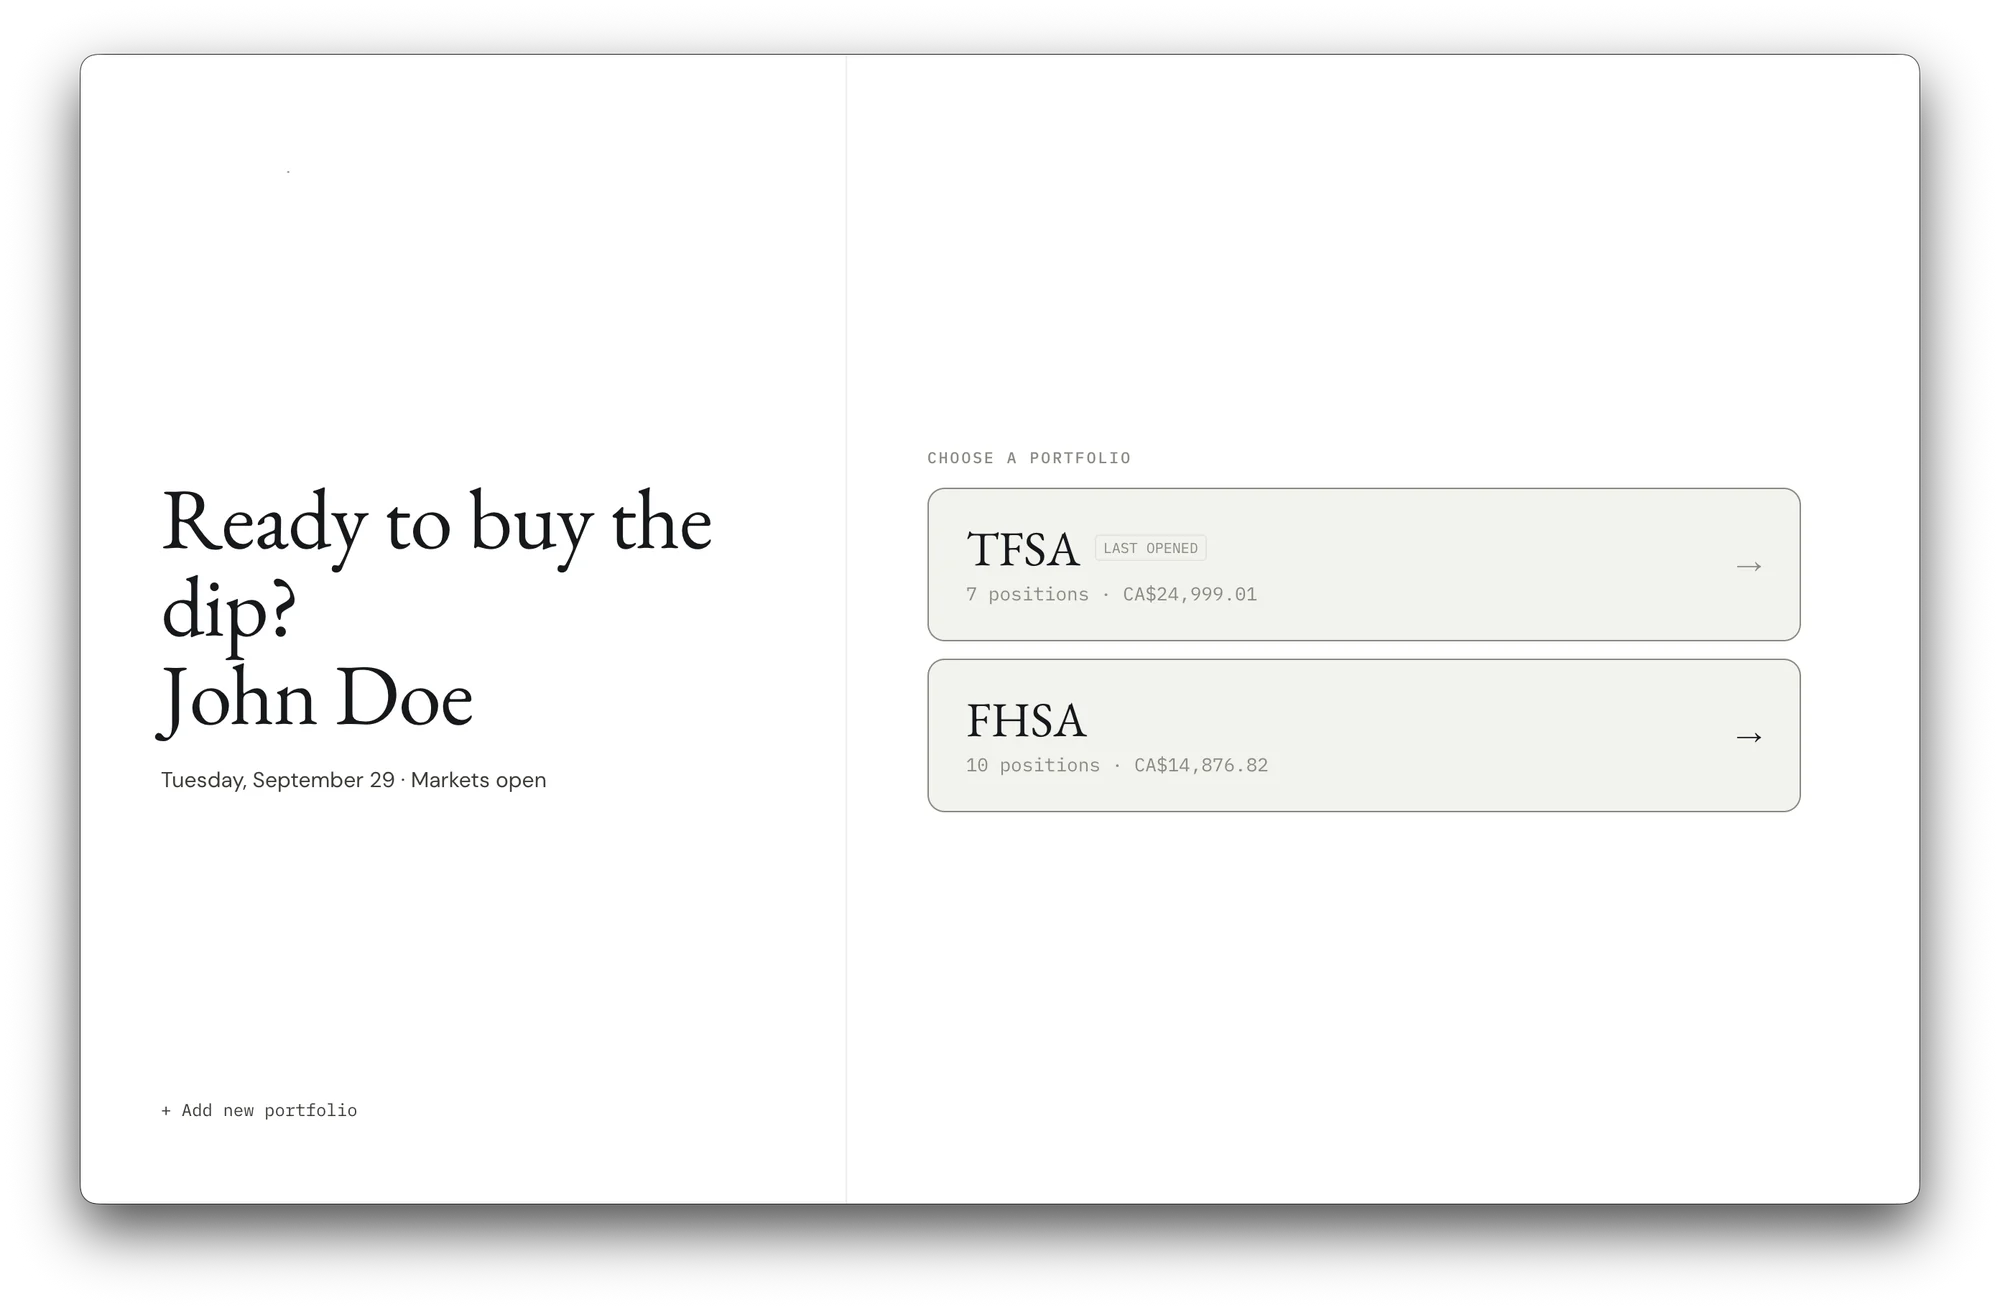
Portfolio picker listing a TFSA and an FHSA with position counts and values Portfolio picker in light mode
Features
  • Separate portfoliosTrack any account, separately
  • Daily summaryWhat moved your money, in one line
  • Benchmark chartPortfolio vs. cost basis vs. a market of your choice
  • Contribution to returnWhich positions did the work
  • CSV importOr add positions by hand
  • Passcode lockOpens only for you

Watchlists
and news

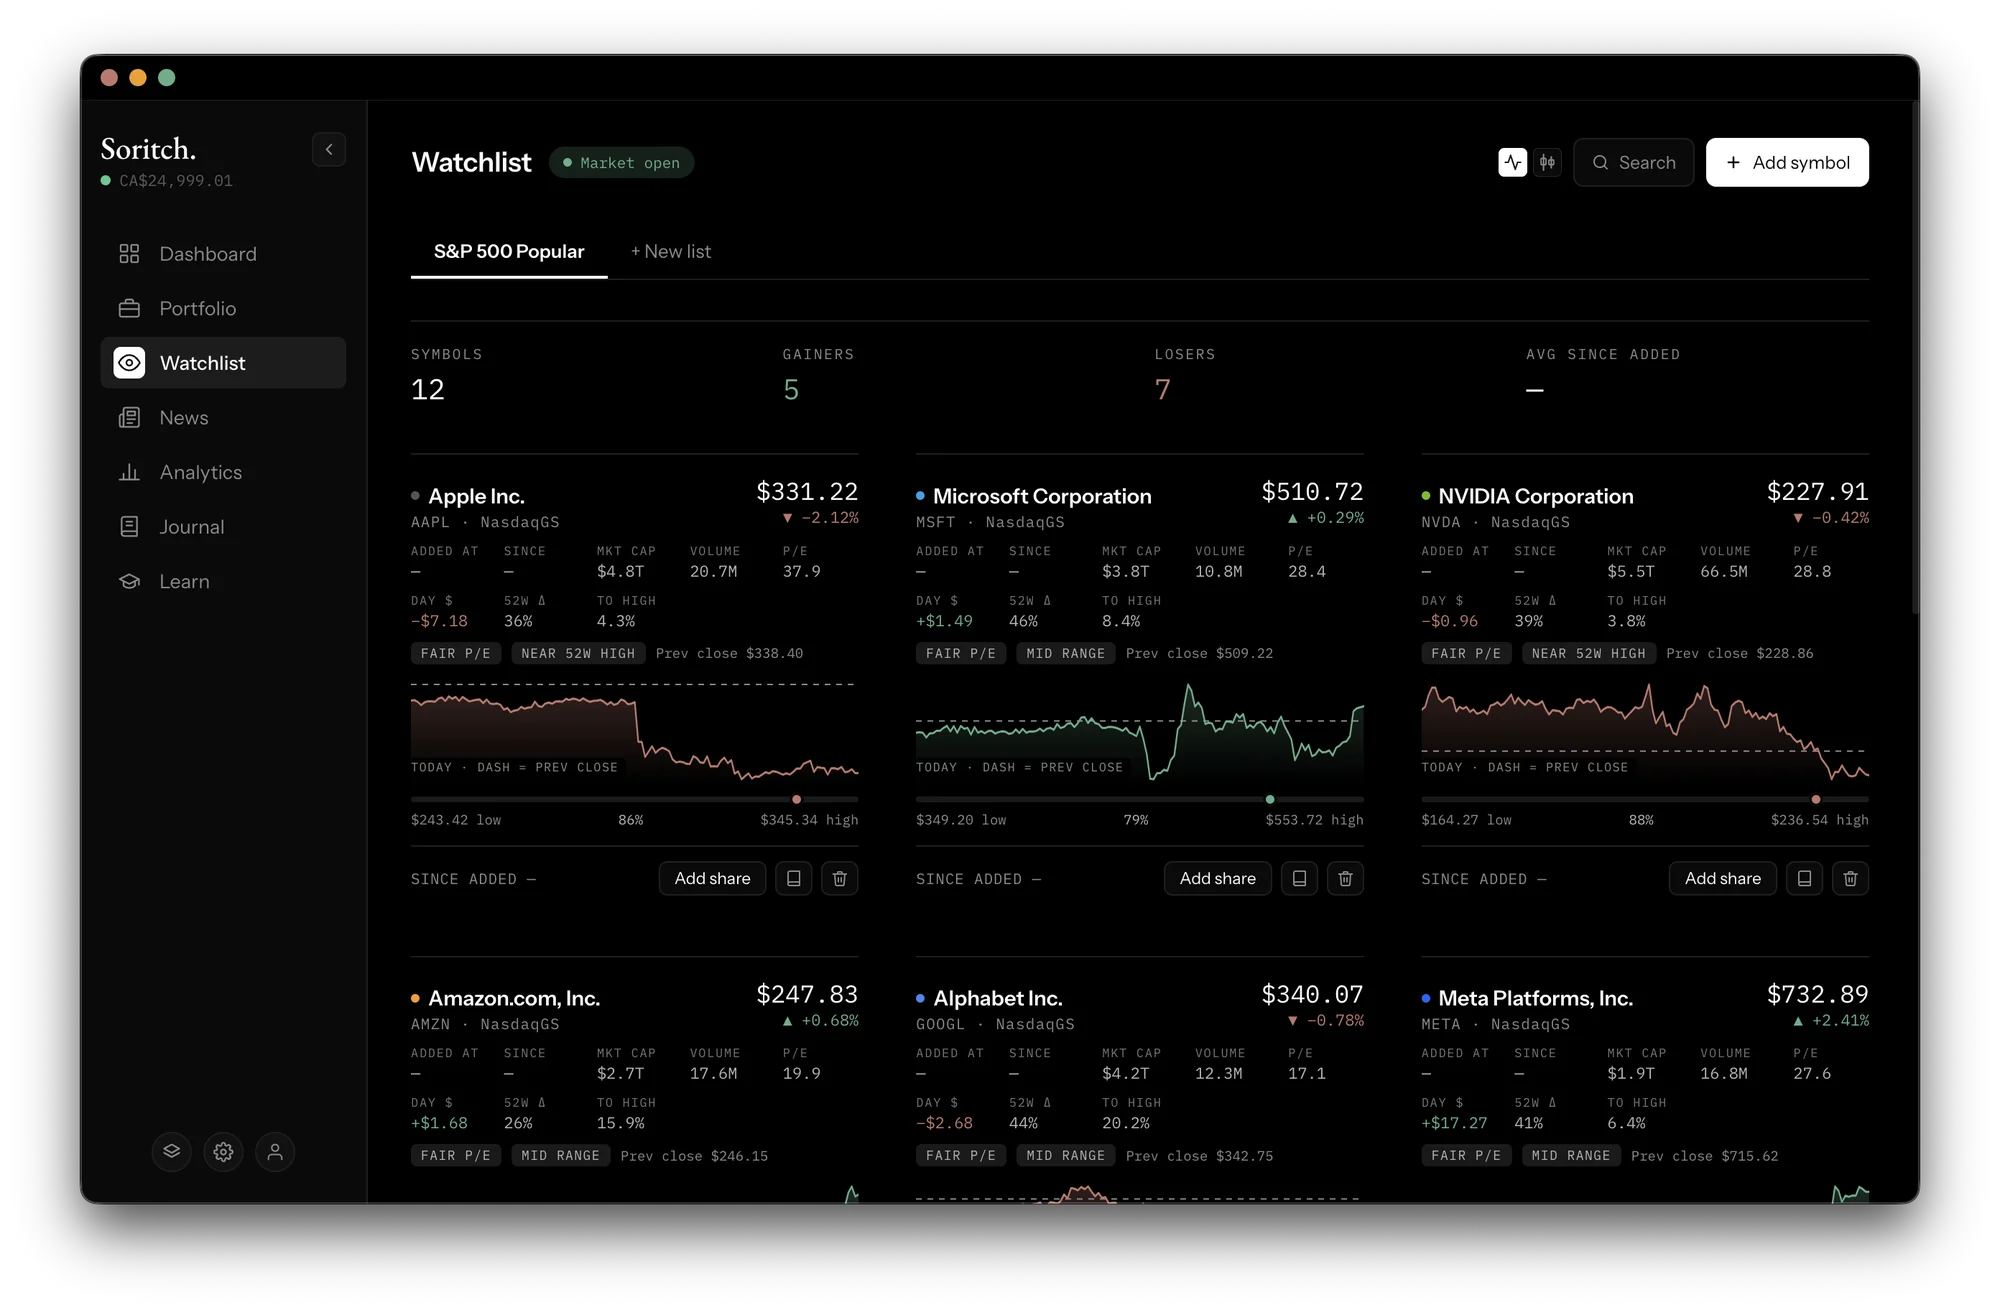
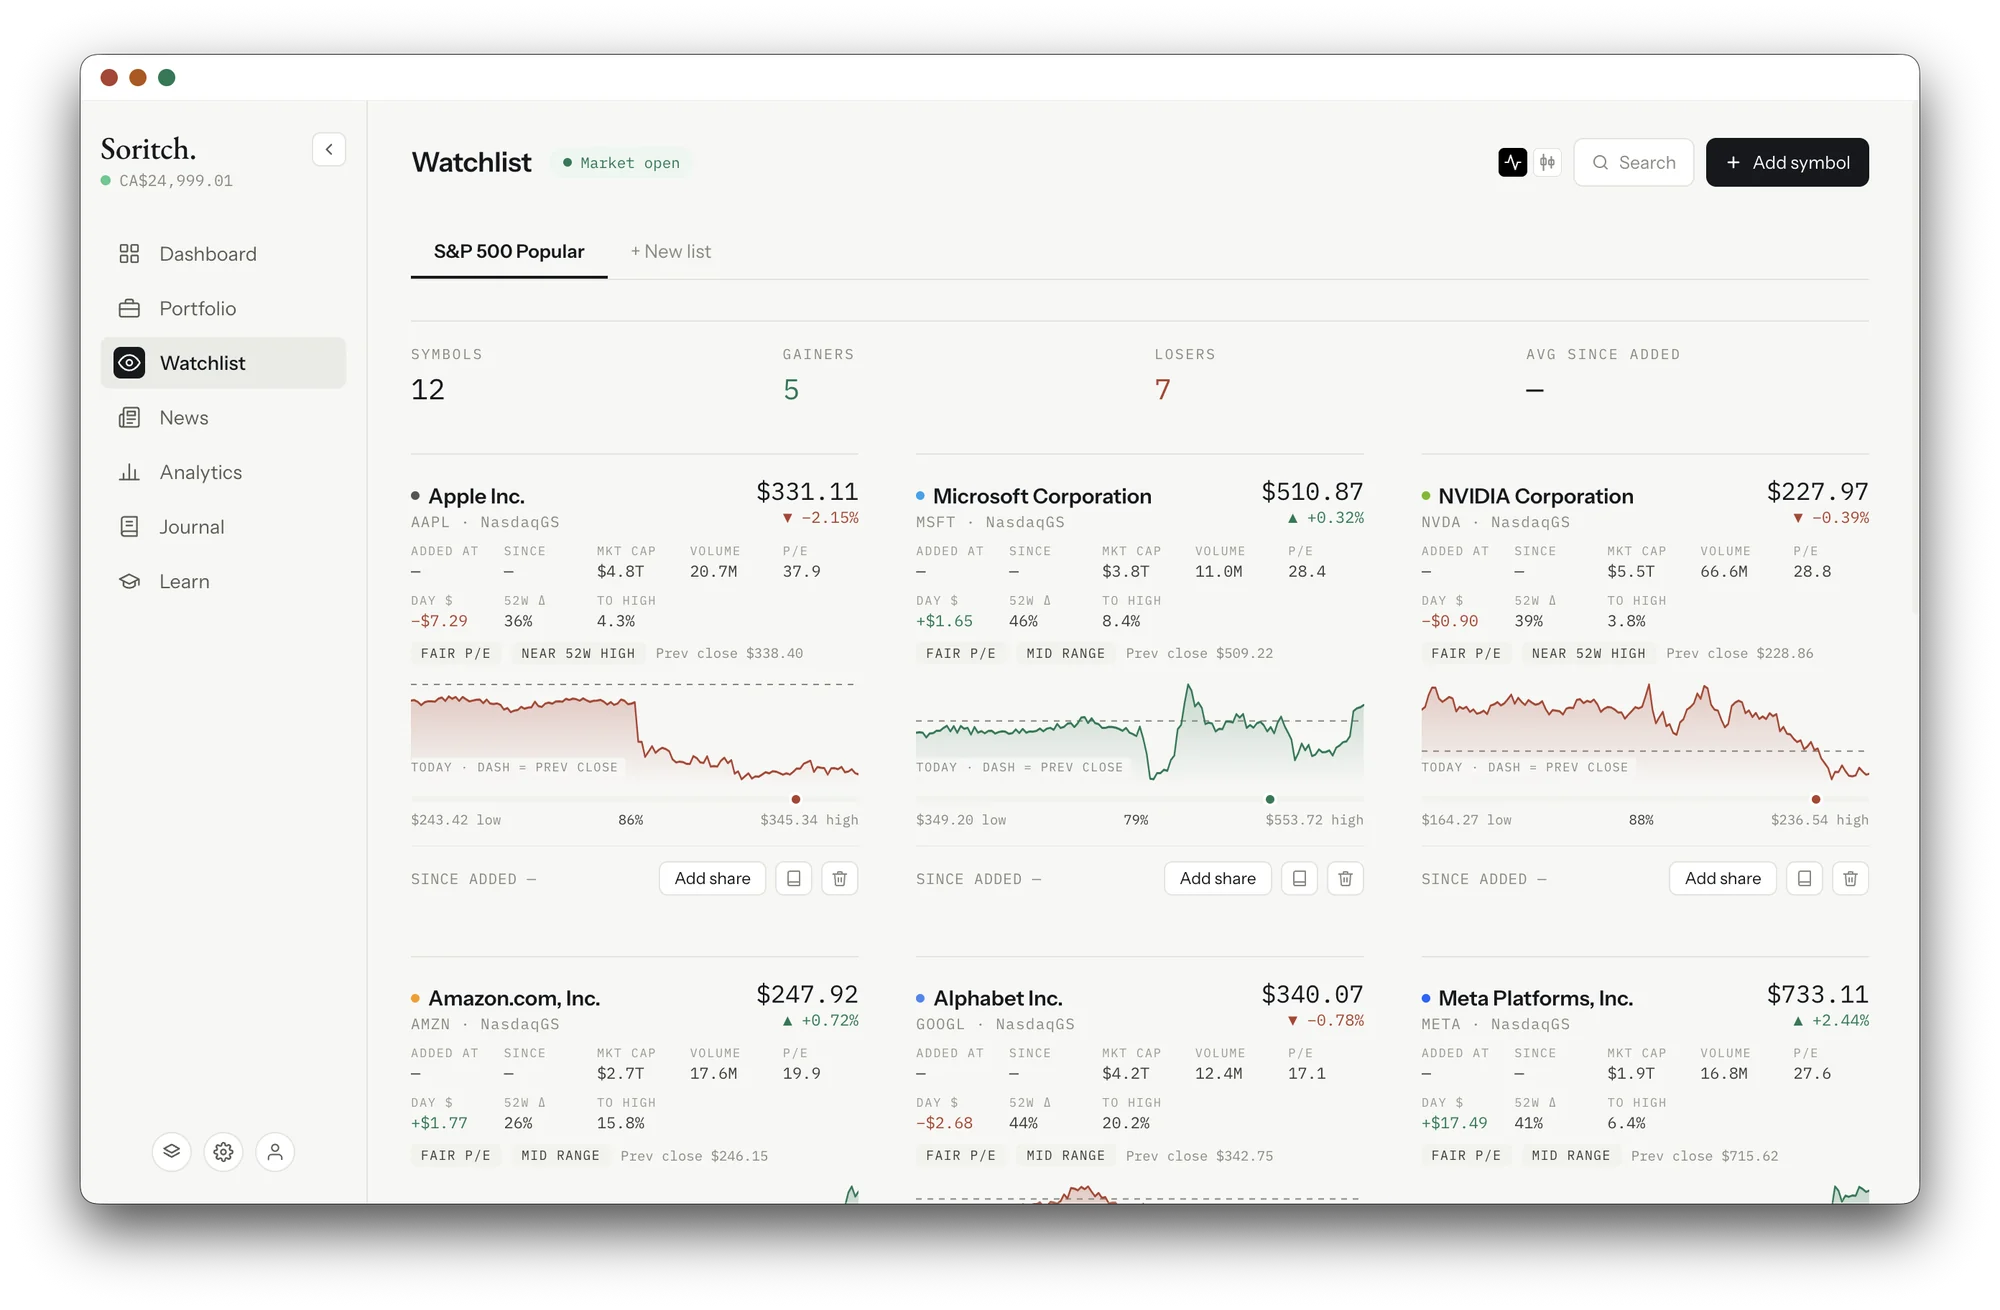
Keep separate watchlists for separate ideas. Each card shows the day, the 52-week range and the valuation at a glance, next to news about the companies you own.

Get early access
Watchlist of symbol cards with intraday charts, 52-week range and valuation tags Watchlist in light mode
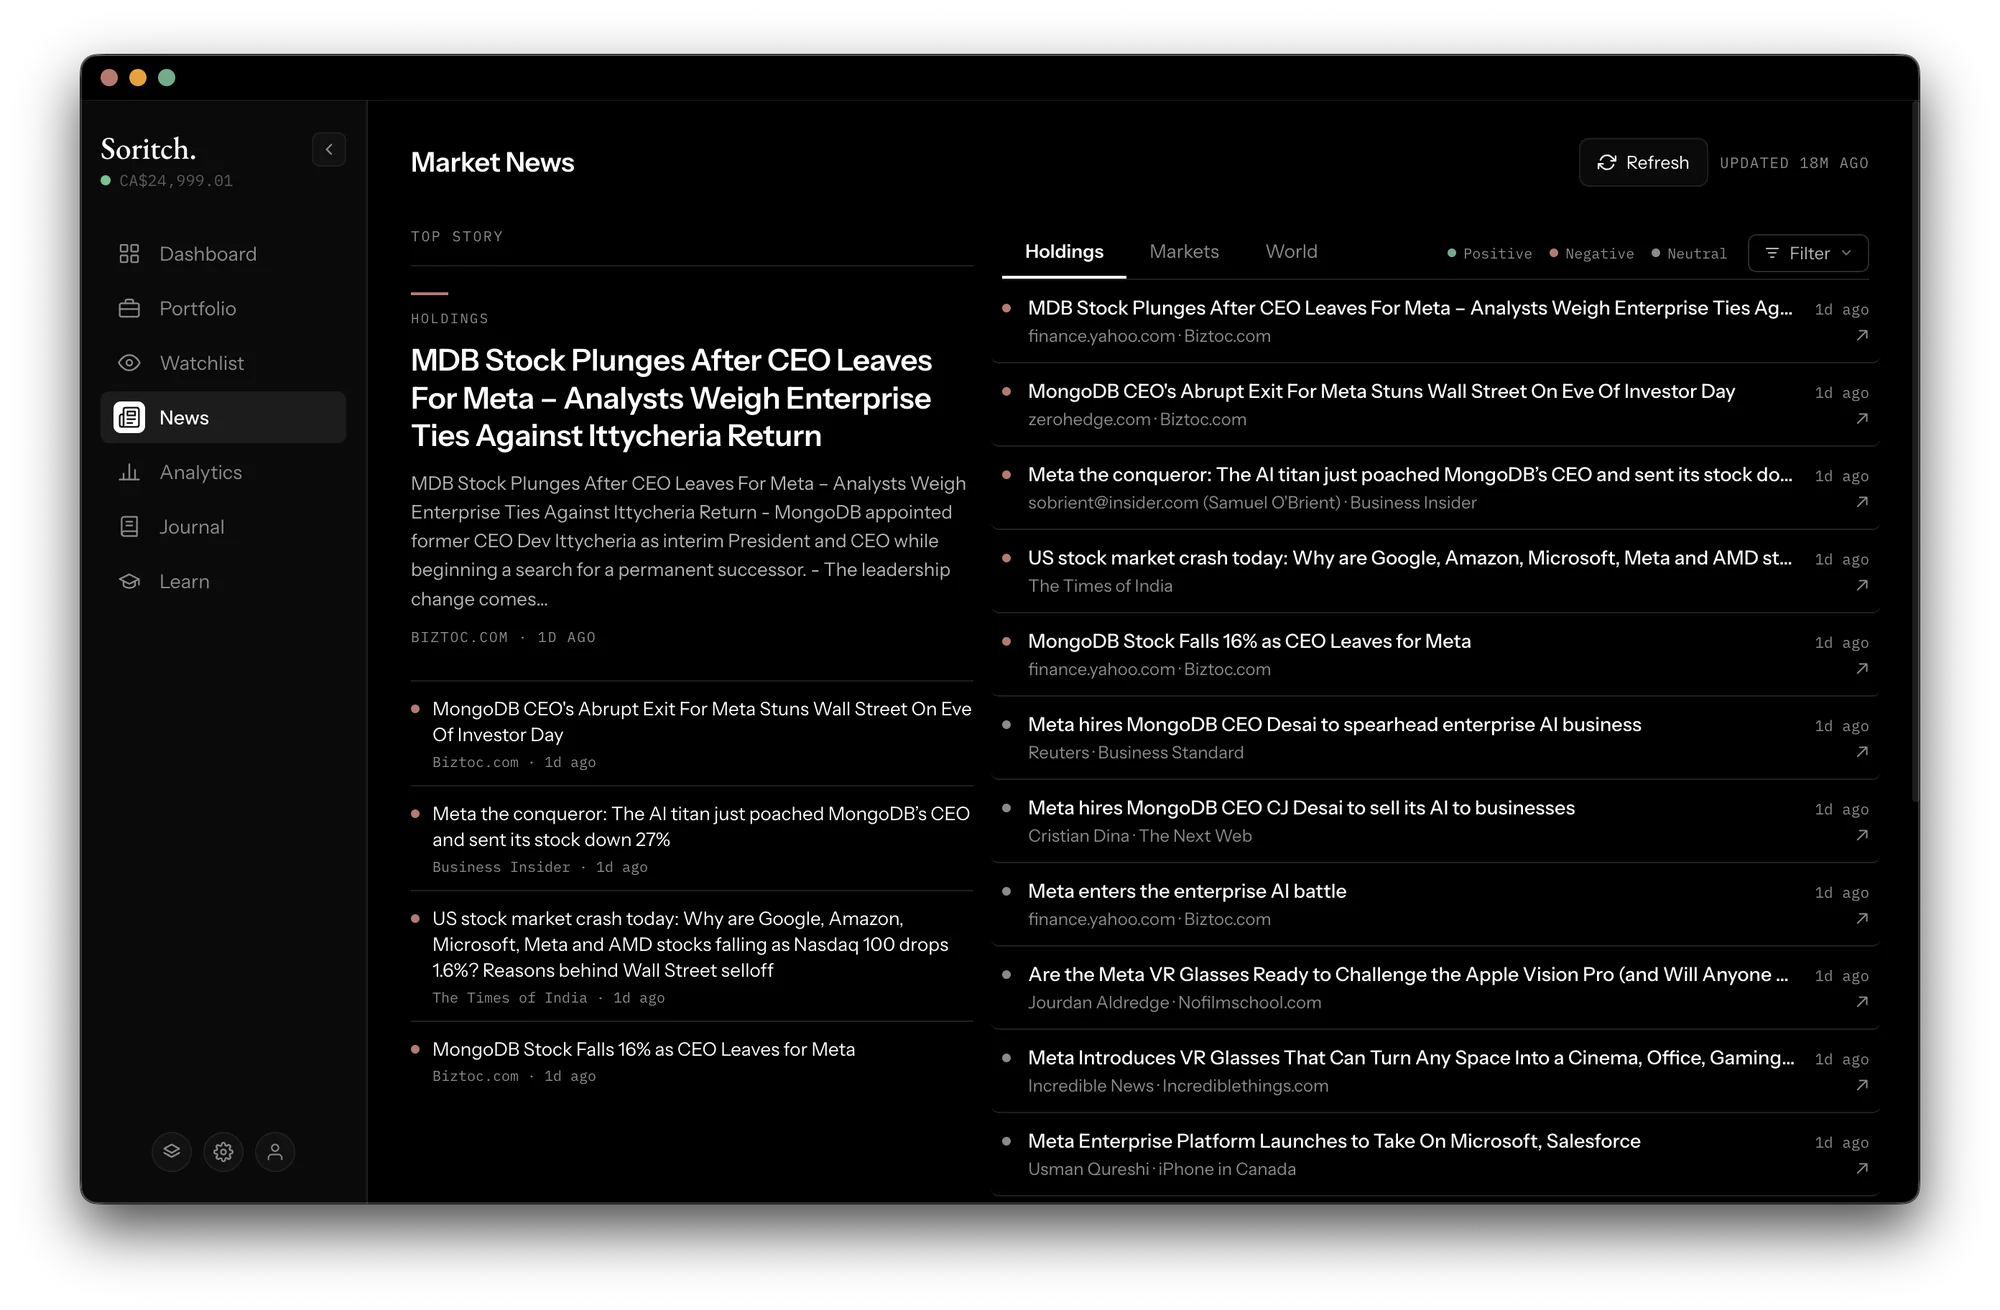
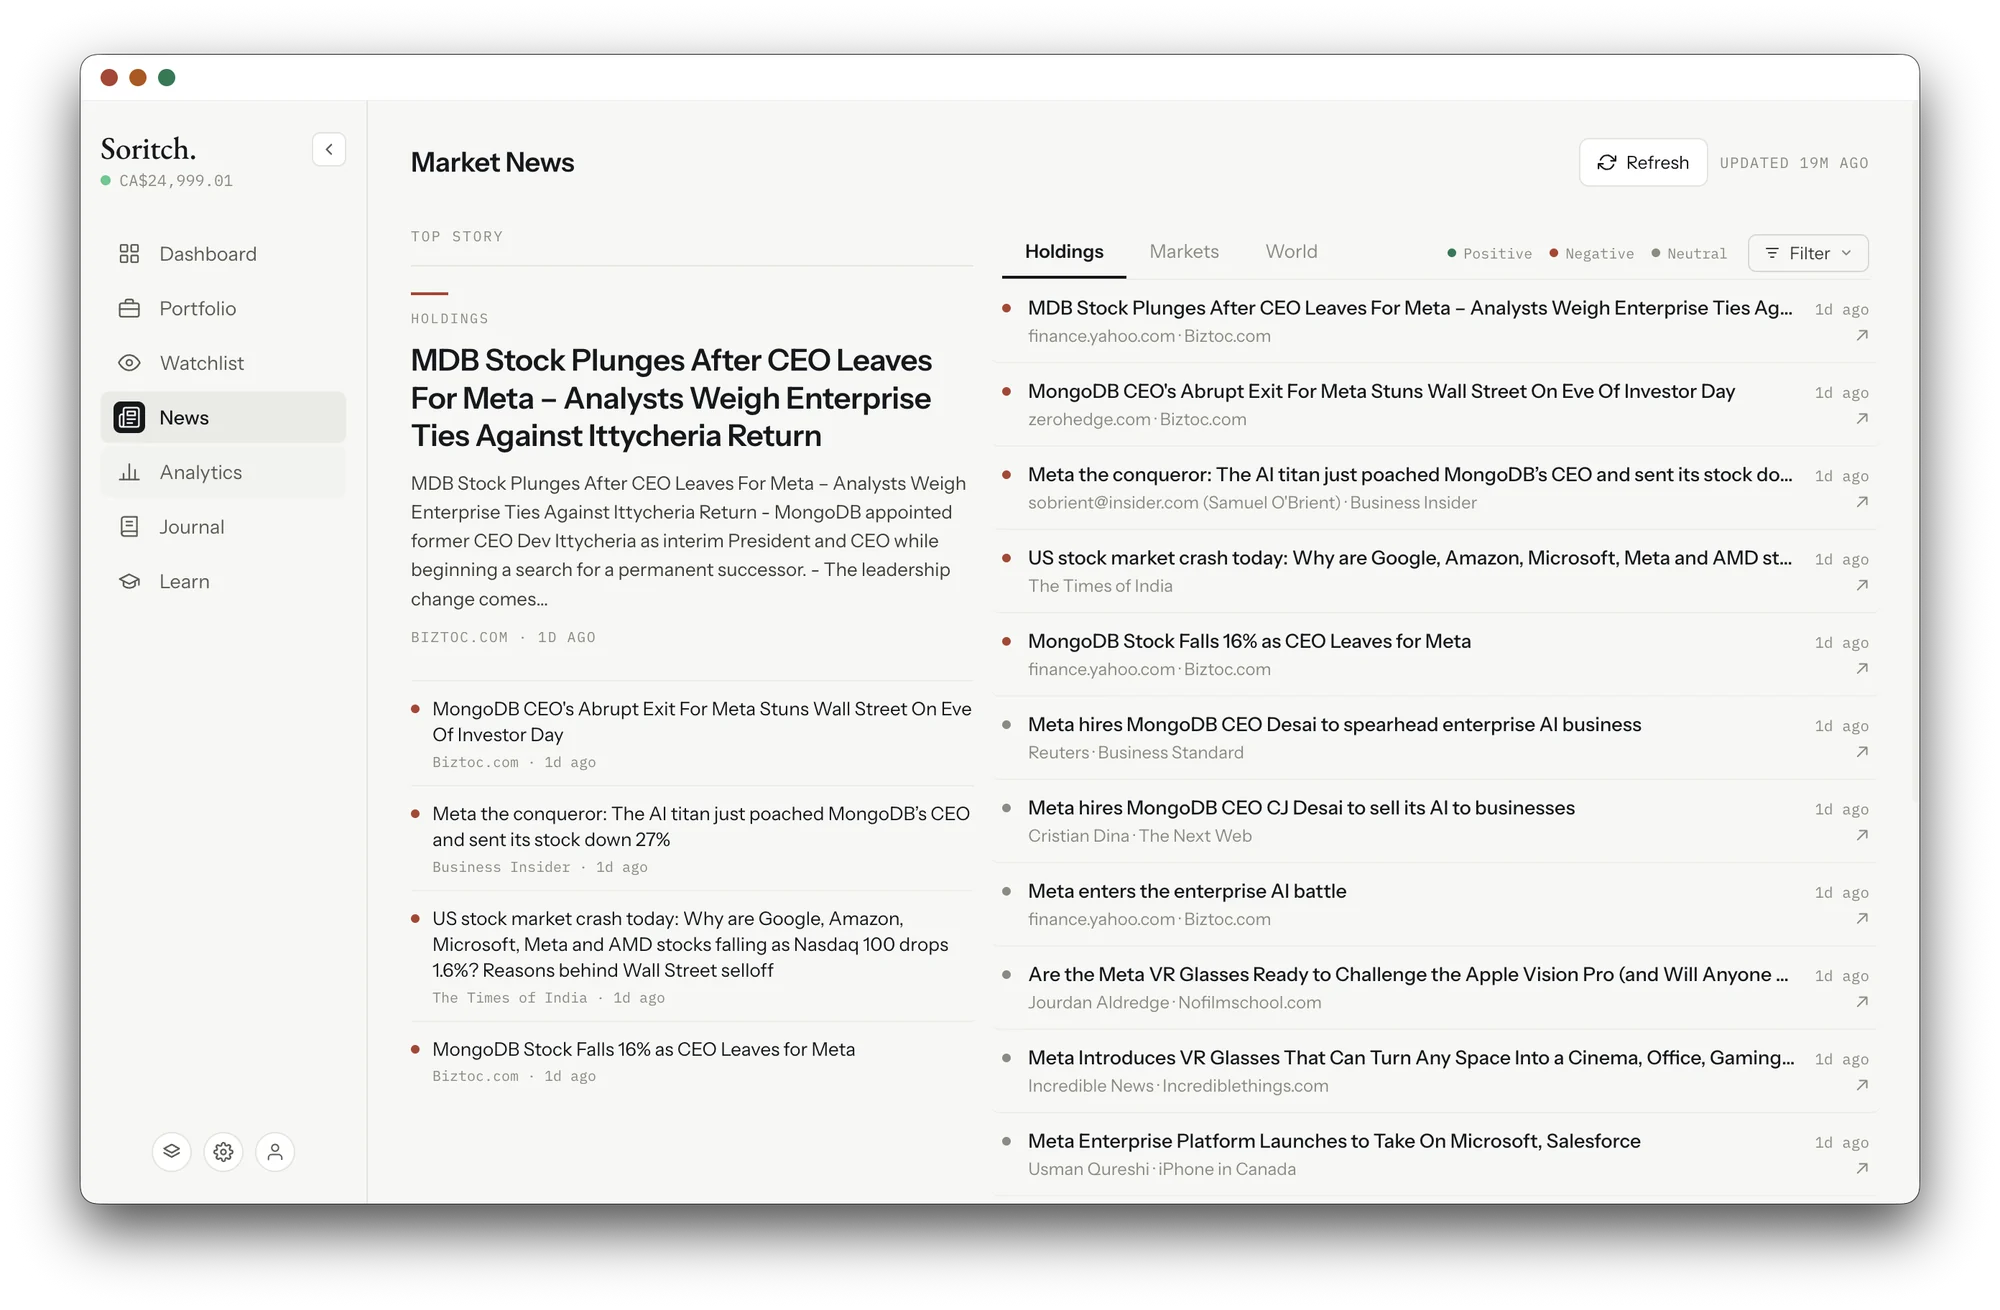
Market news screen with a top story and holdings headlines marked by sentiment Market news in light mode
Features
  • Multiple watchlistsOne list per idea or sector
  • Valuation tagsFair P/E, Near 52W high, Mid range
  • Gain since addedSee how an idea played out
  • Holdings newsStories about what you own
  • Headline sentimentPositive, negative or neutral
  • Markets and WorldThe wider picture, one tab away

Analysis
and scoring

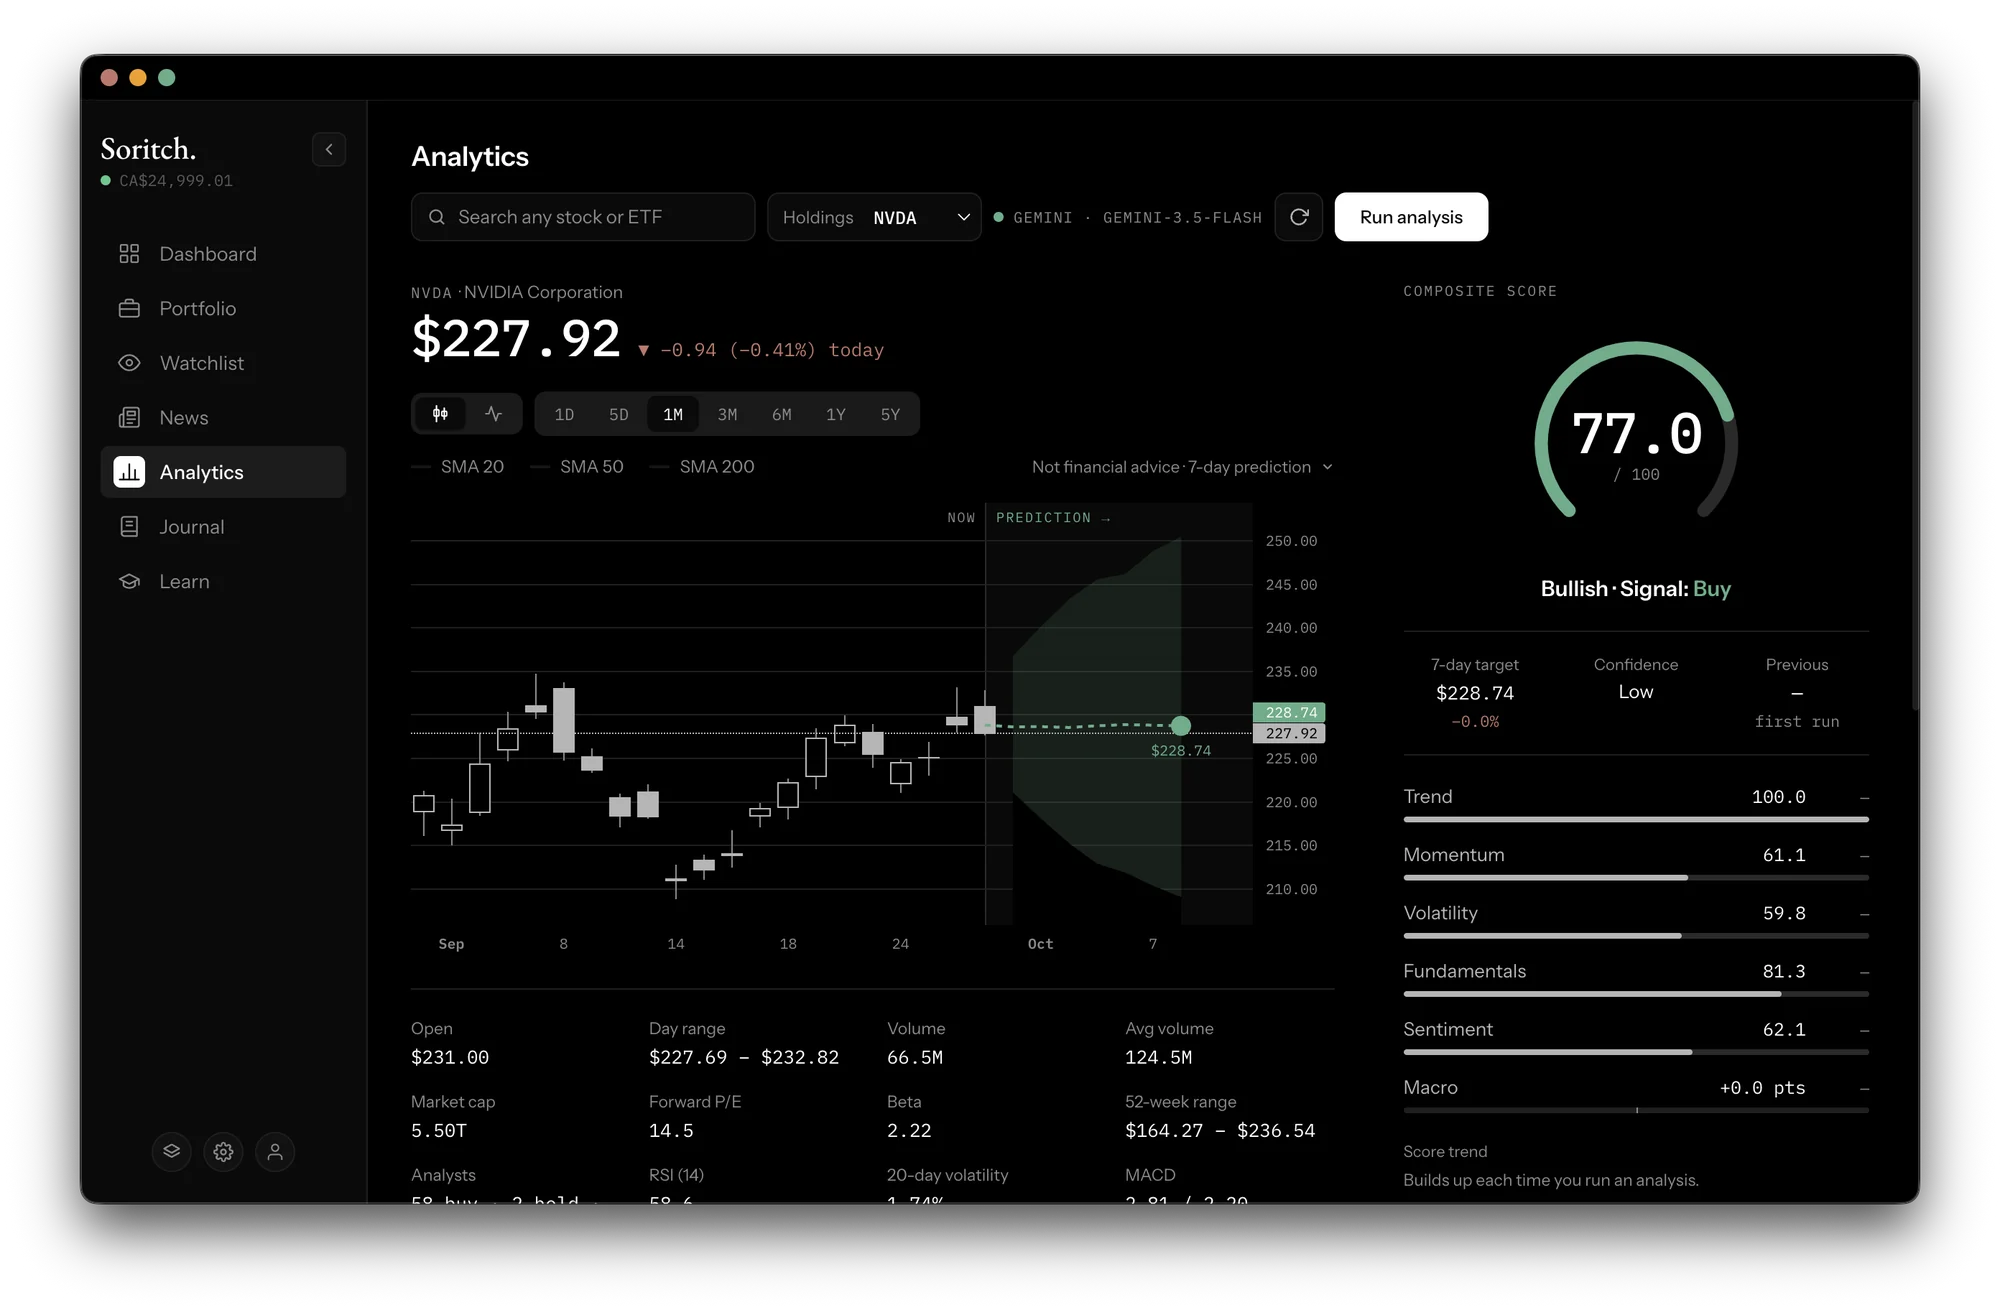
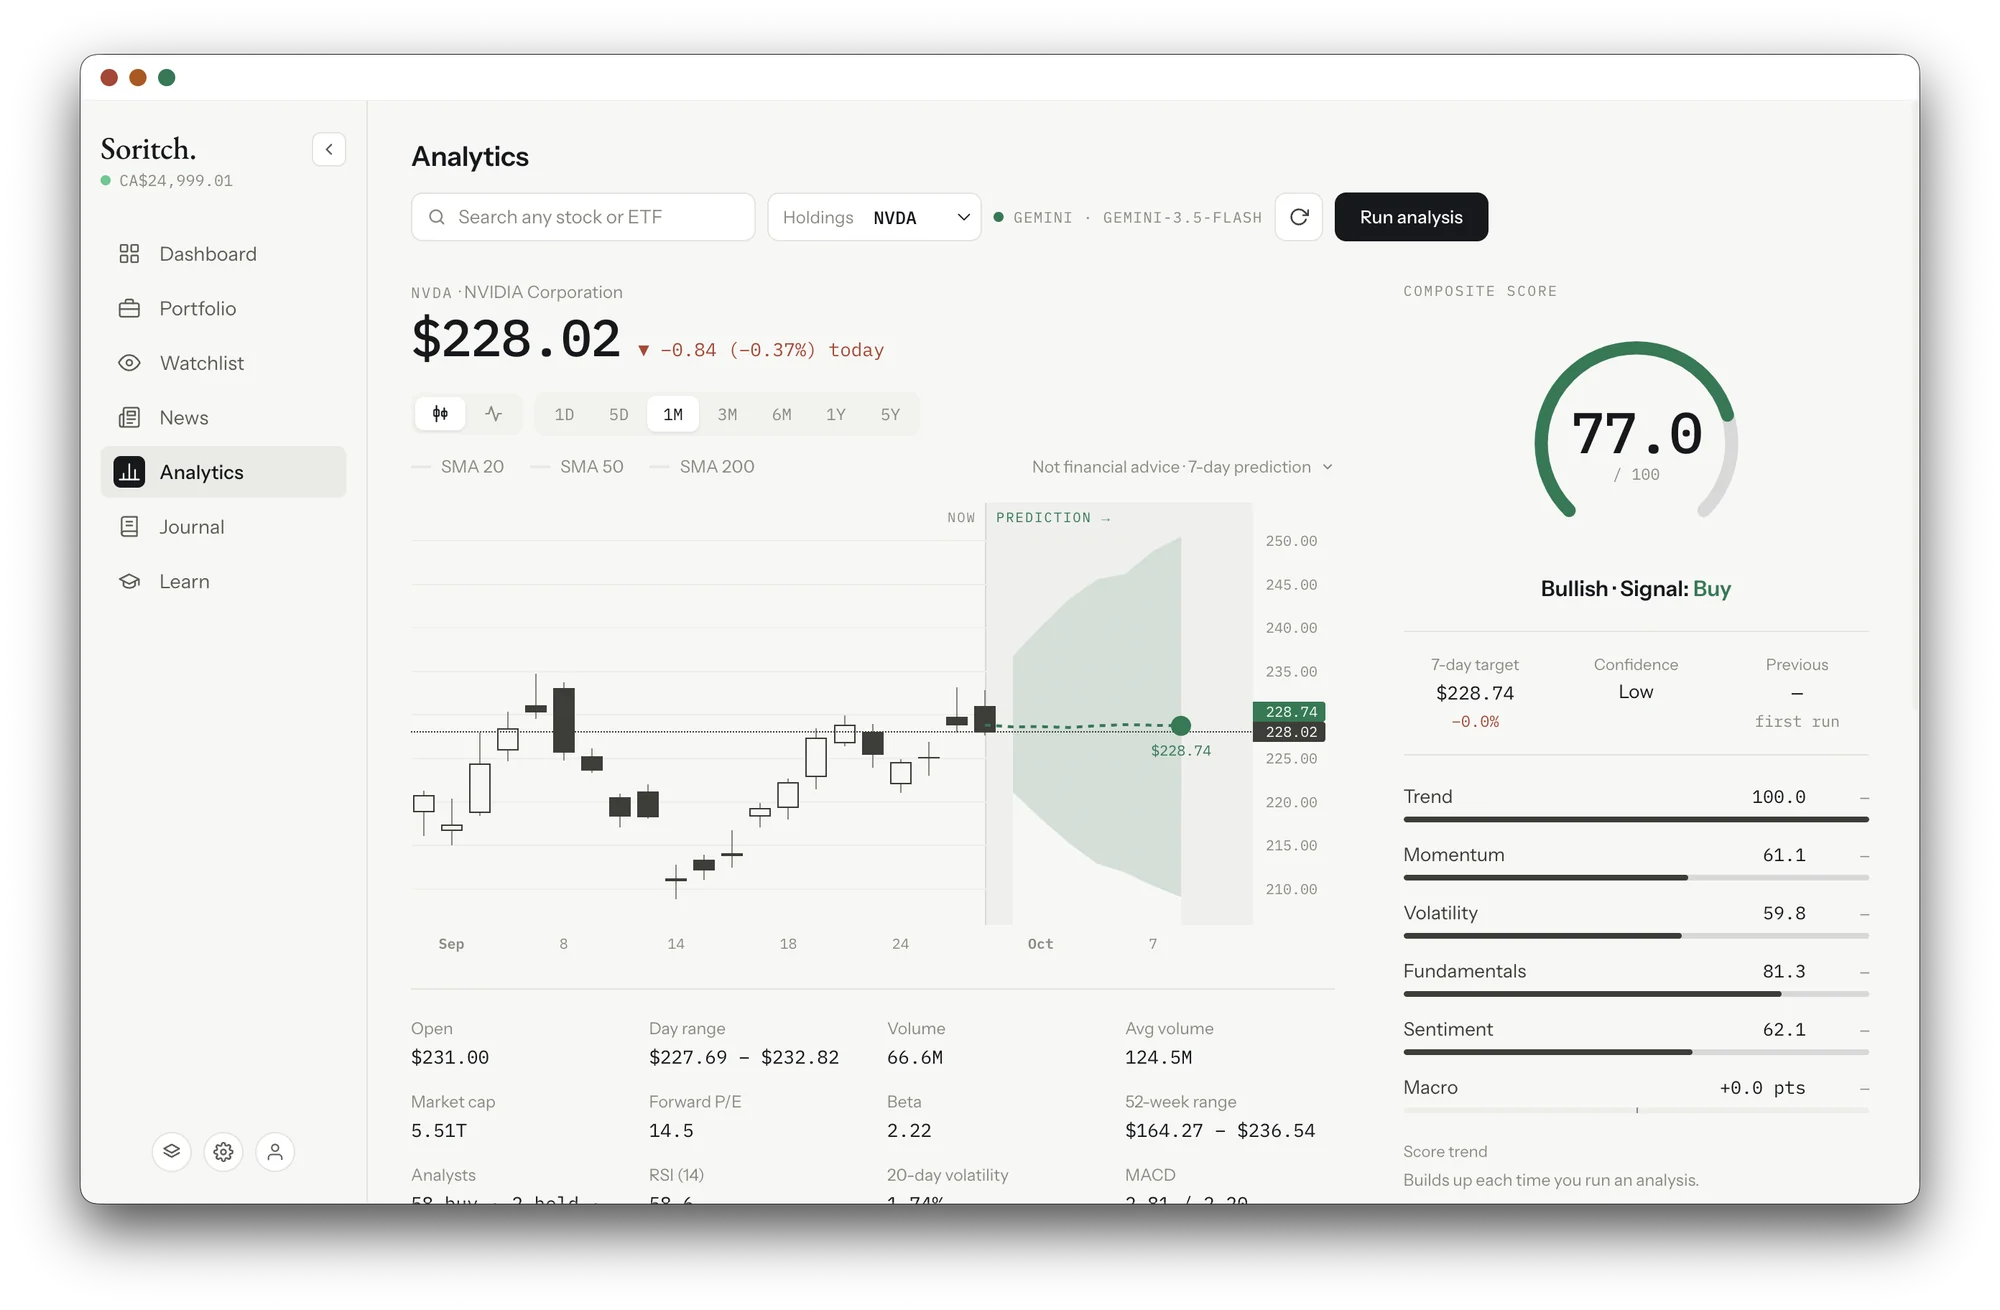
Run an analysis on any stock or ETF and get a score from 0 to 100, a signal, and a 7-day price range.

Get early access
Analytics screen for NVDA with a candlestick chart, 7-day prediction band and a composite score of 77 Analytics in light mode
0.0/ 100
NVDA · Composite score

Bullish · Signal: Buy

  • Trend100.0
  • Momentum61.1
  • Volatility59.8
  • Fundamentals81.3
  • Sentiment62.1
  • Macro+0.0 pts
Features
  • Composite scoreFive categories plus a macro adjustment
  • 7-day projectionTarget price with a confidence level
  • Score historyBuilds up with every run
  • Candlestick chartsWith SMA 20, 50 and 200
  • Key statsP/E, beta, RSI, MACD, analyst ratings

Journal
and learning

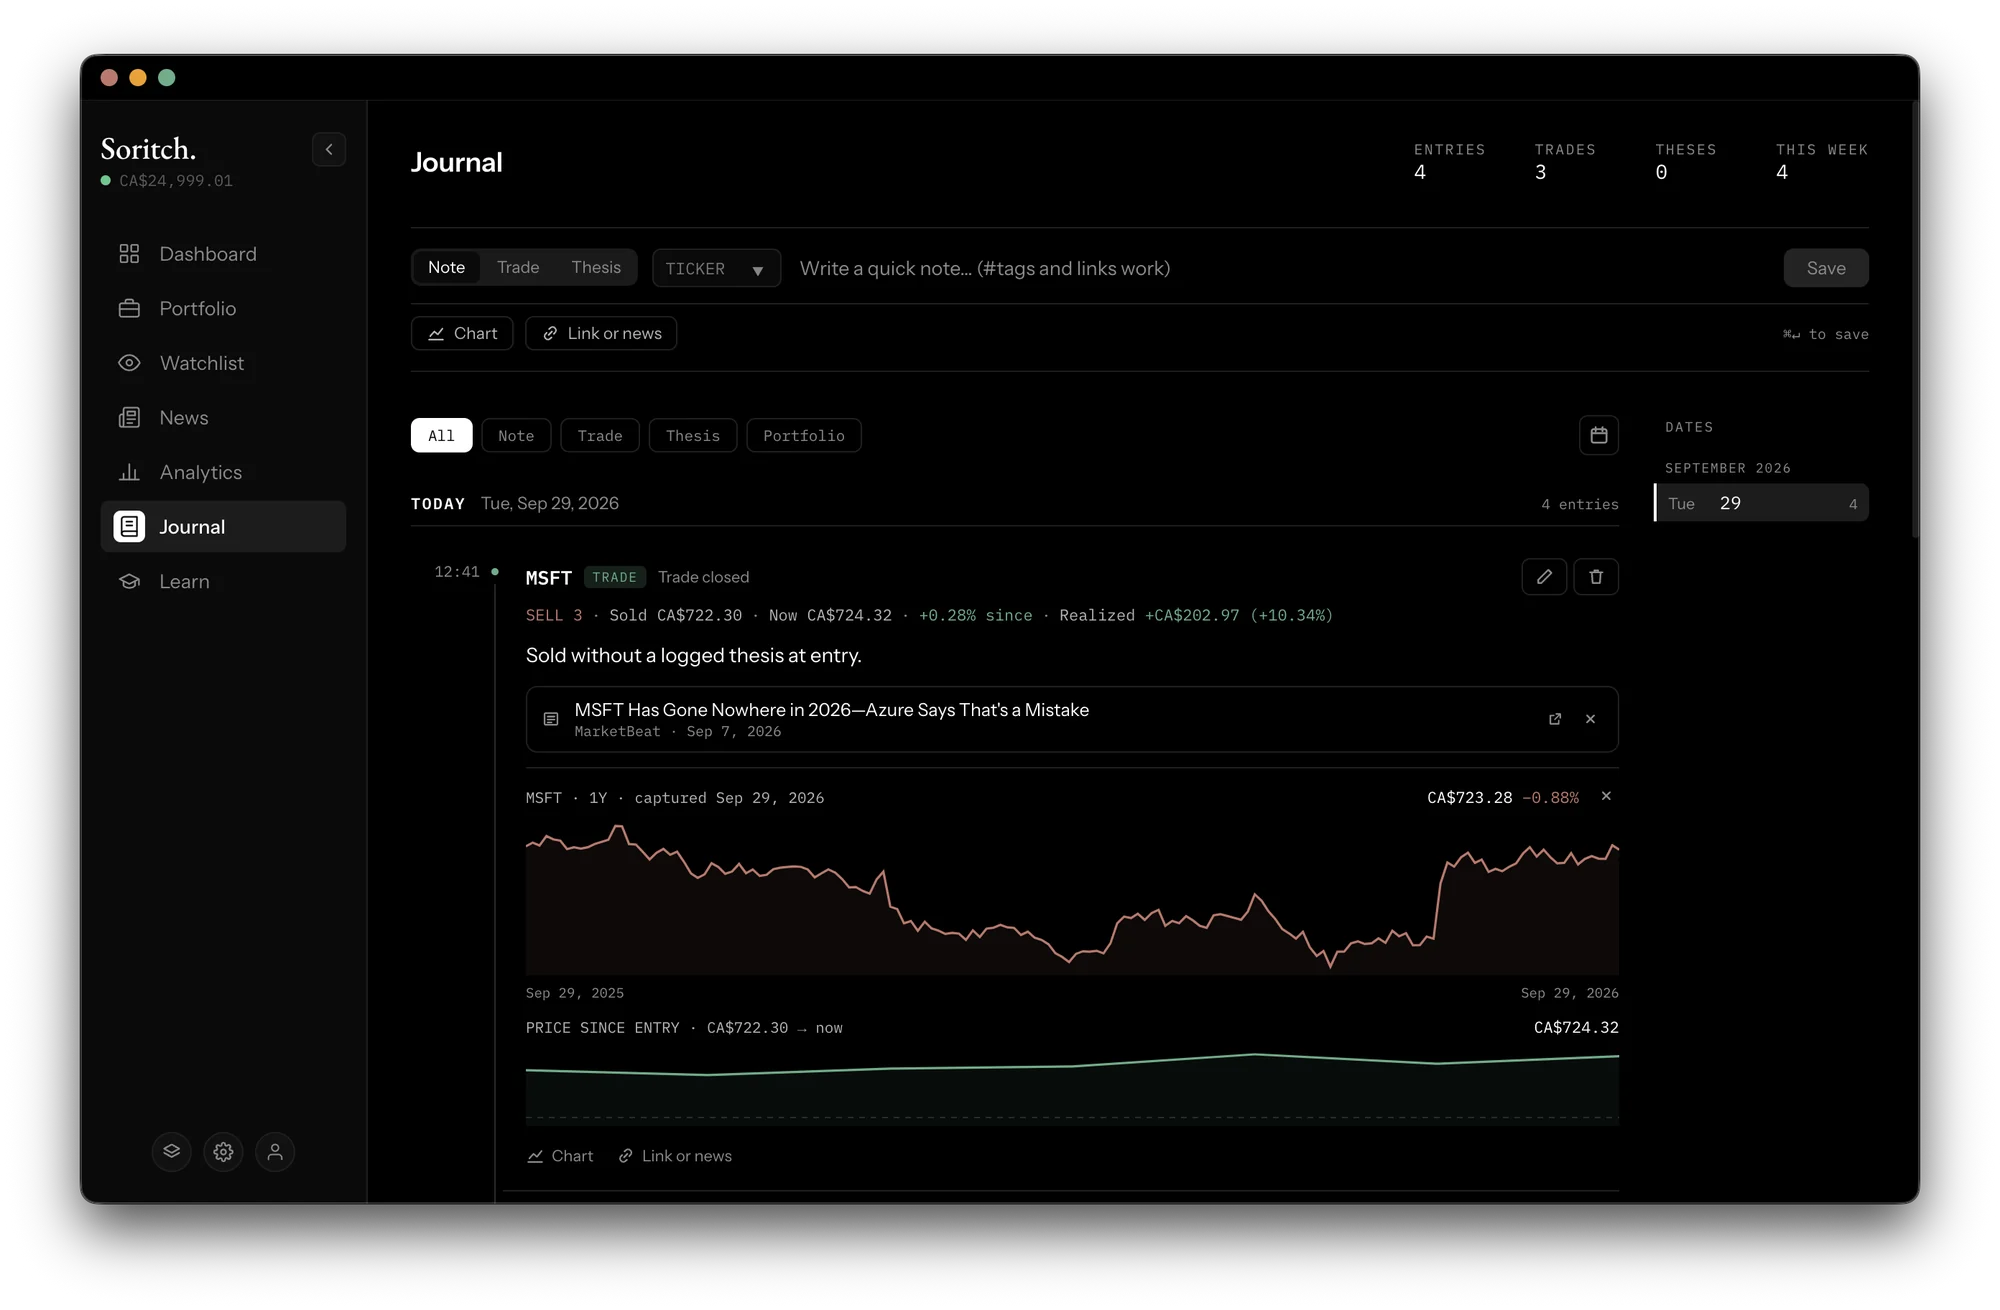
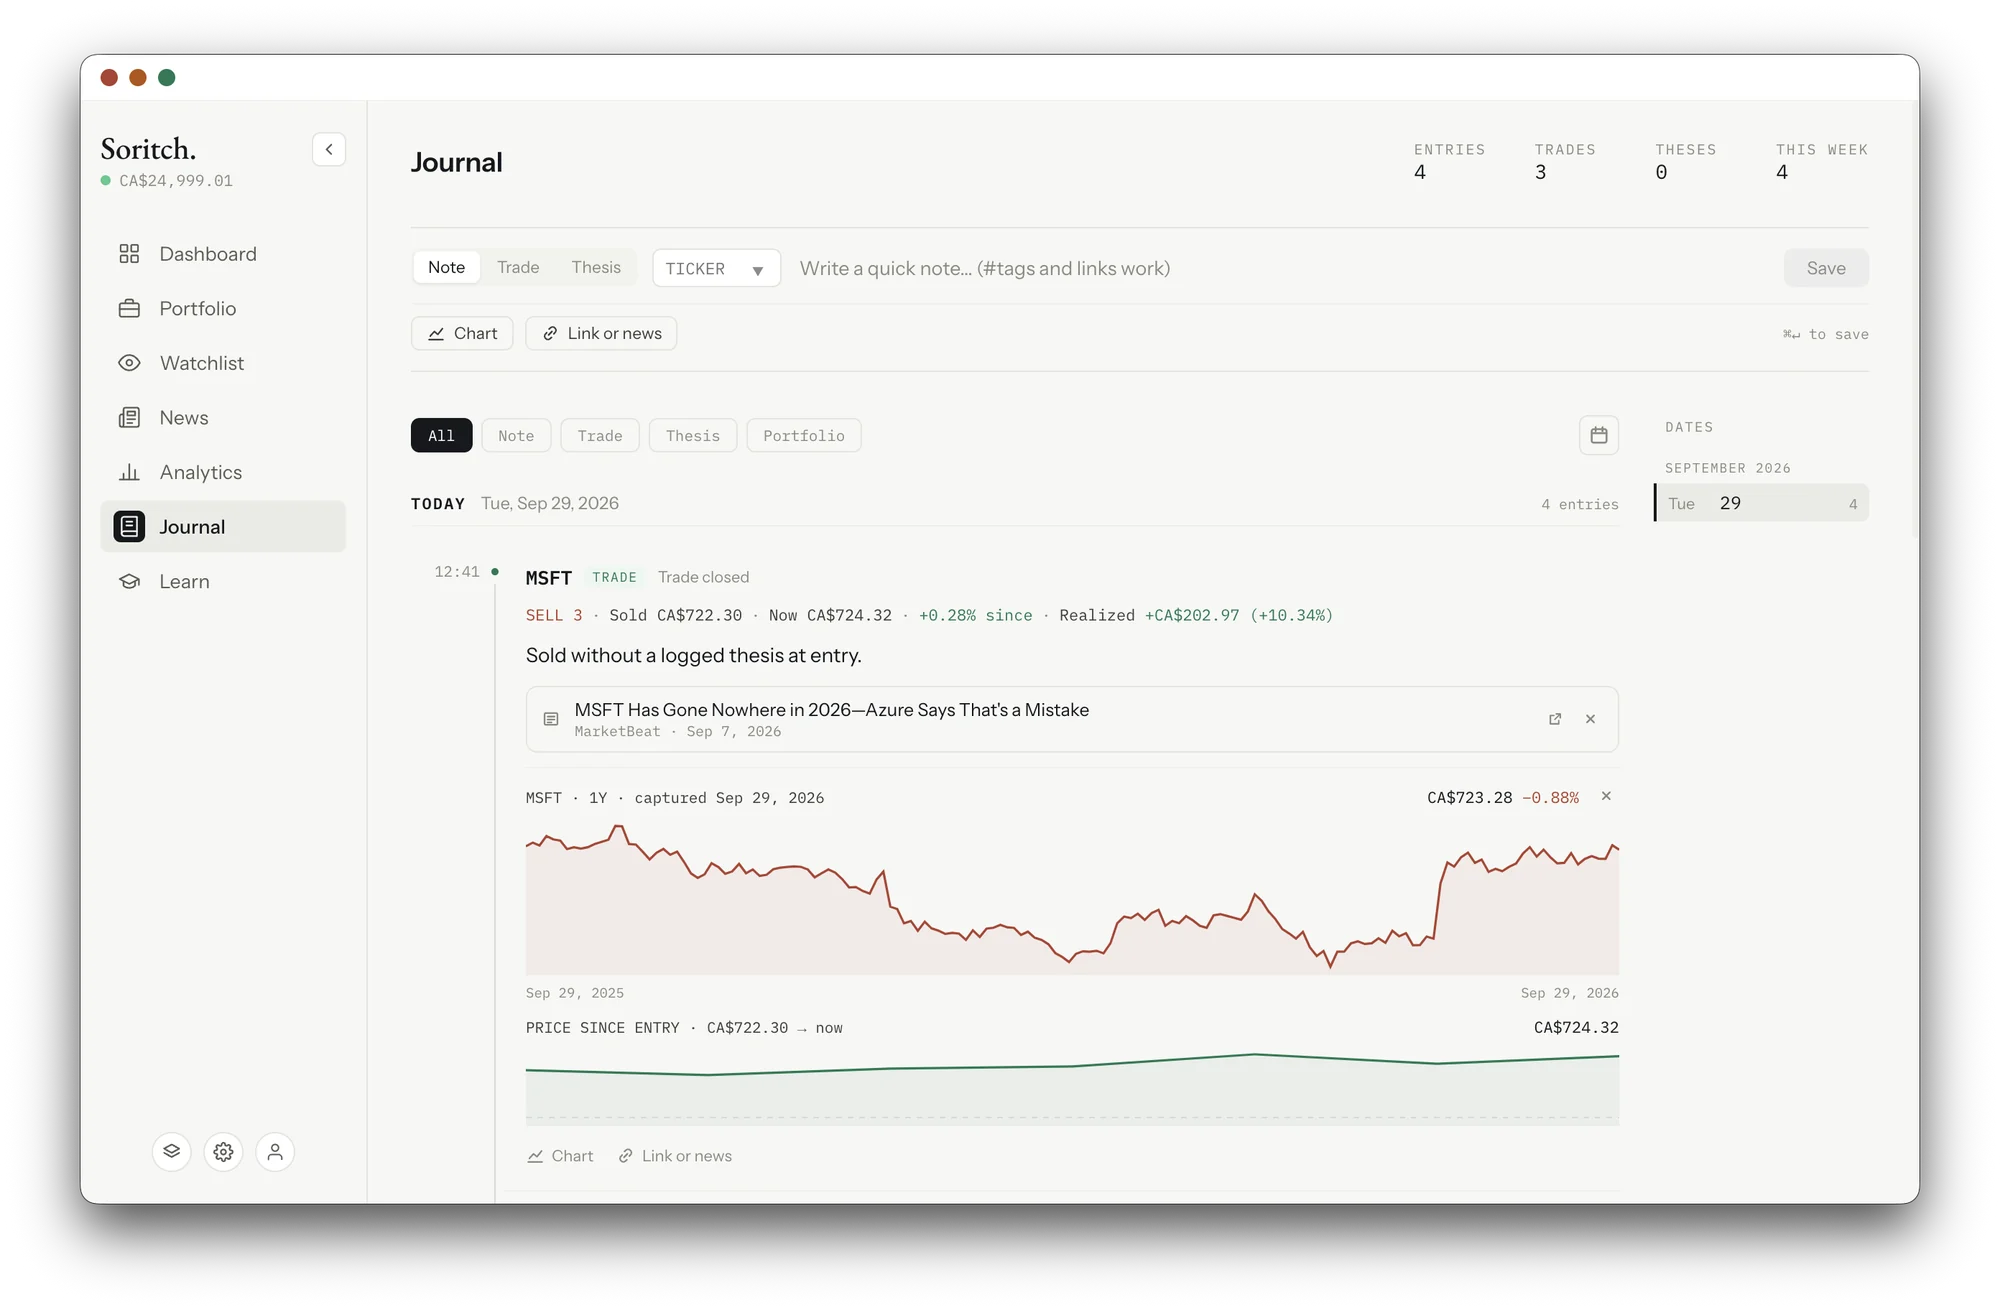
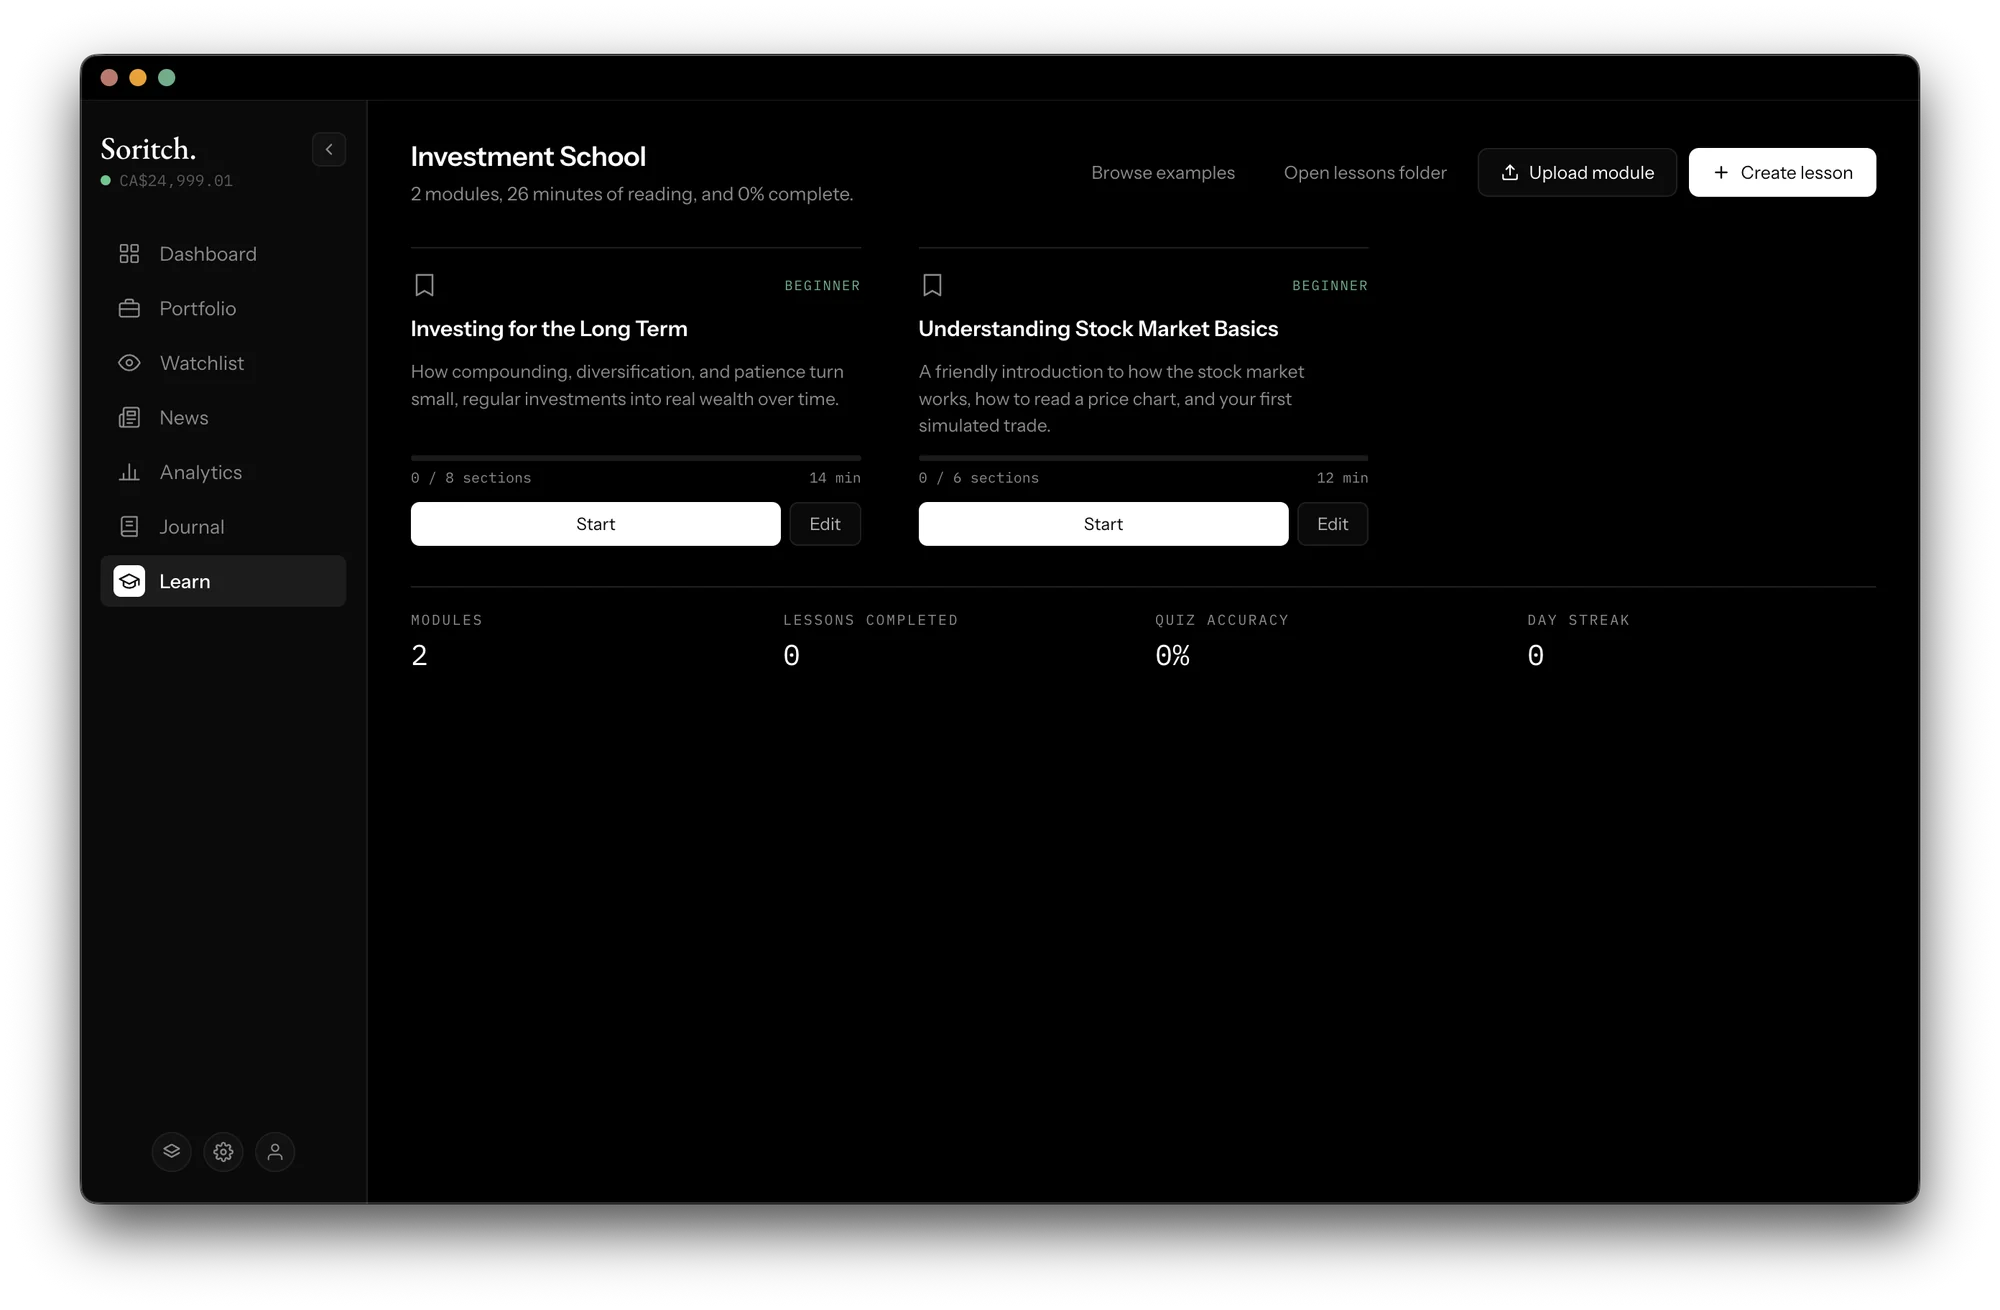
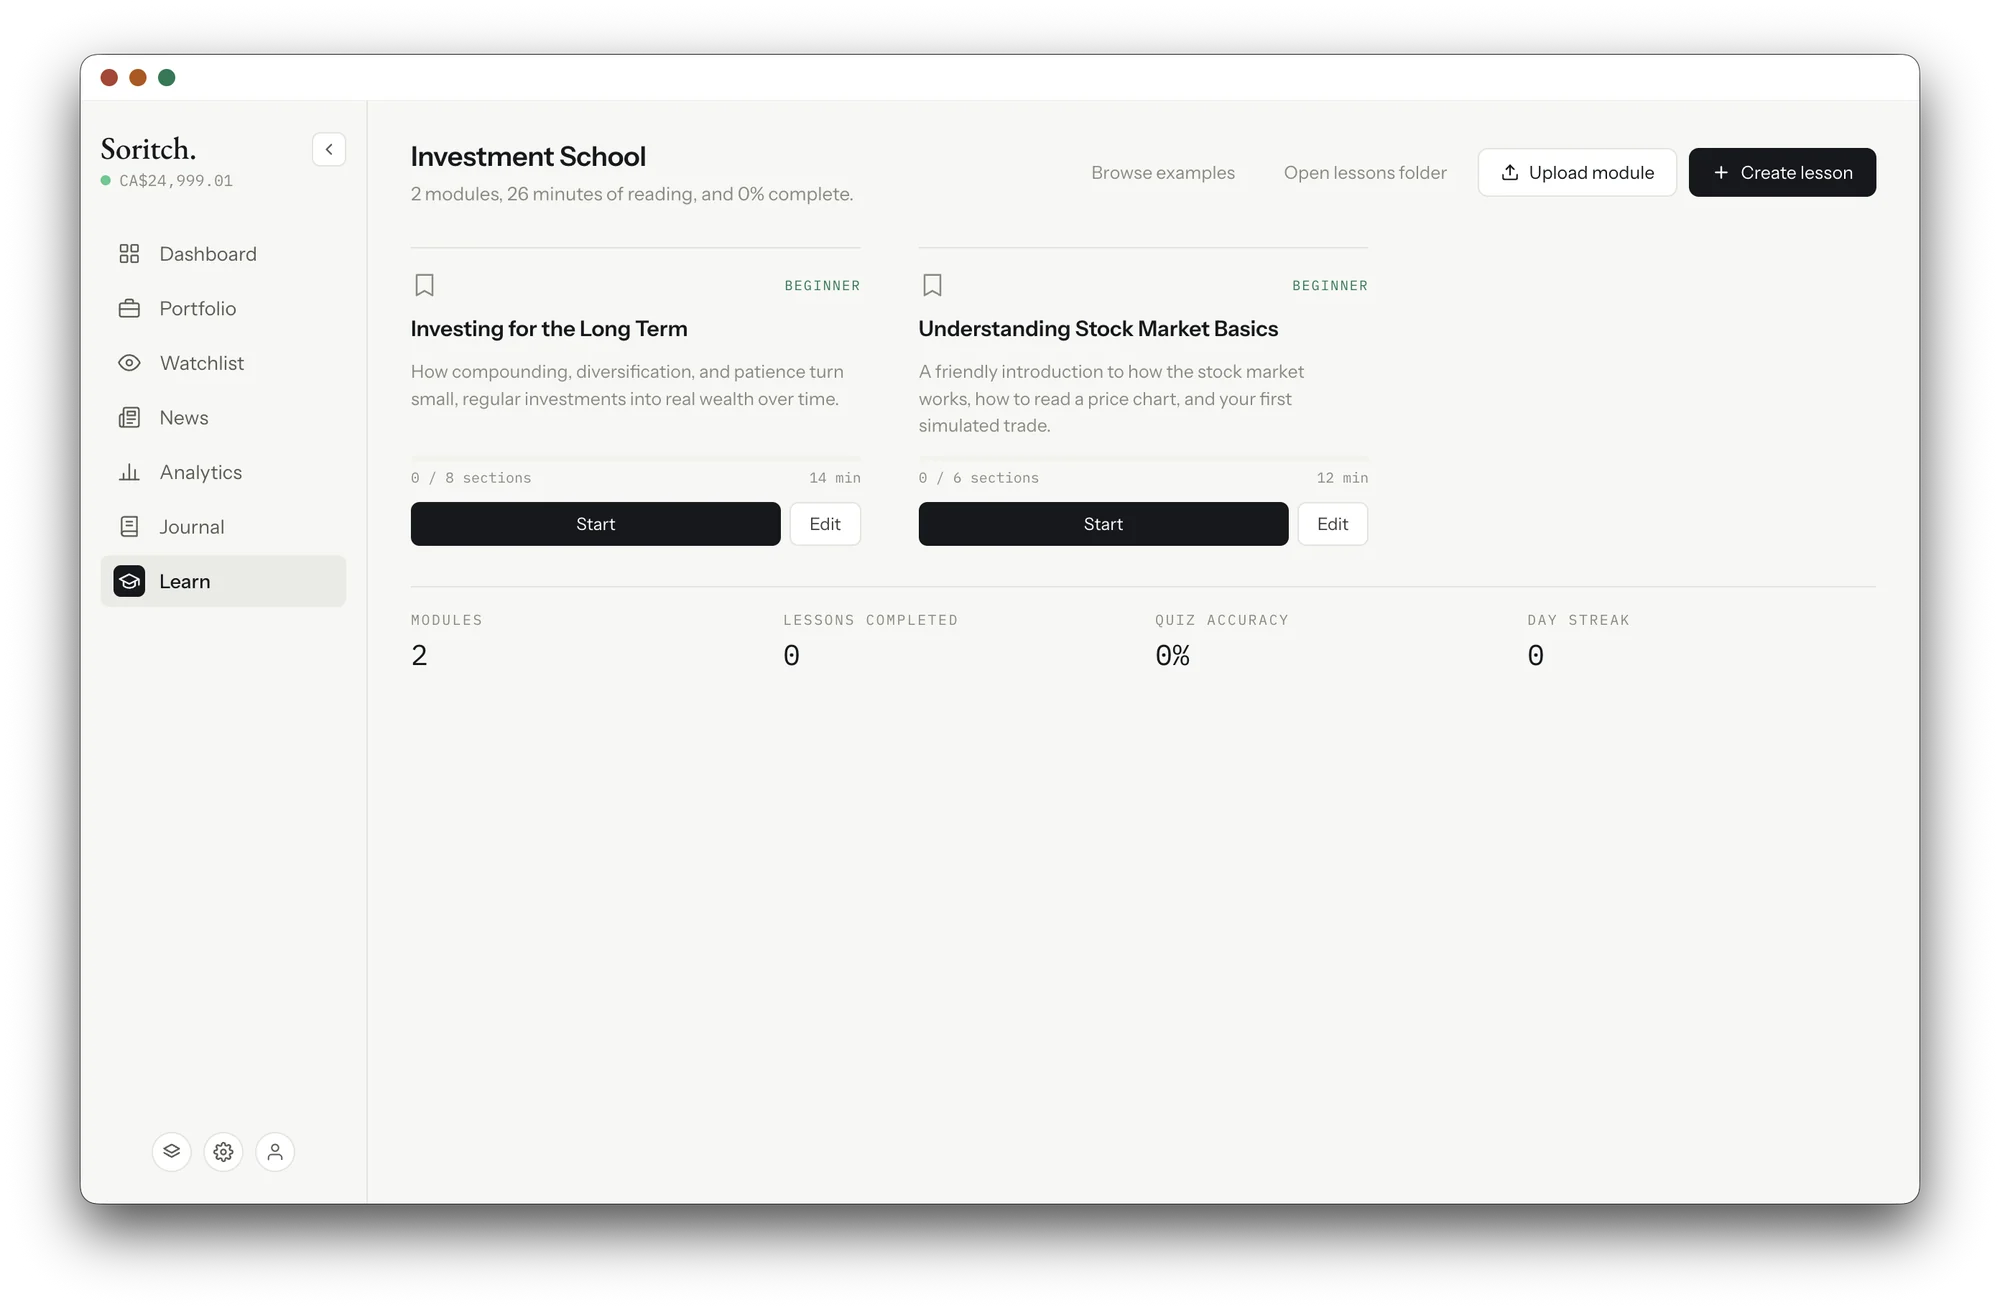
Write down why you bought. Each entry saves the chart as it looked that day and tracks the price from there. Built-in lessons cover the basics, with quizzes at the end.

Get early access
Journal with a closed MSFT trade, an attached article and a saved one-year chart Journal in light mode
Investment School screen with two beginner modules and progress stats Investment School in light mode
Features
  • Notes, trades, thesesThree kinds of entry
  • Saved chartsWhat the price looked like that day
  • Missing-thesis checkFlags sells with no reason on file
  • Investment SchoolShort lessons for beginners
  • Quizzes and streaksTrack what you've finished
  • Your own modulesWrite, edit or upload lessons

Private by design.
Arriving soon.

You're on the list.

macOS & Windows · One email when your invite is ready

Have an access code? Enter it here.